In this article, we would see how to add linear regression equation and r-squared to a graph in R. It is very useful when we need to document or present our statistical results. Many people are familiar with R-square as a performance metrics for linear regression. If you are novice in linear regression technique, you can read this article - Linear Regression with R
Create Sample Data
The following program prepares data that is used to demonstrate the method of adding regression equation and rsquare to graph.
Create Sample Data
The following program prepares data that is used to demonstrate the method of adding regression equation and rsquare to graph.
x = c(1:250)Load Required Library
mydata= data.frame(x, y= 30 + 2.5 * x + rnorm(250,sd = 25))
library(ggplot2)R Function
linear = function(k) {
z <- list(xx = format(coef(k)[1], digits = 2),
yy = format(abs(coef(k)[2]), digits = 2),
r2 = format(summary(k)$r.squared, digits = 3));
if (coef(k)[2] >= 0) {
eq <- substitute(italic(hat(y)) == xx + yy %.% italic(x)*","~~italic(r)^2~"="~r2,z)
} else {
eq <- substitute(italic(hat(y)) == xx - yy %.% italic(x)*","~~italic(r)^2~"="~r2,z)
}
as.character(as.expression(eq));
}
fo = y ~ x
linplot <- ggplot(data = mydata, aes(x = x, y = y)) + geom_smooth(method = "lm", se=FALSE, color="black", formula = fo) + geom_point()
linplot1 = linplot + annotate("text", x = 100, y = 500, label = linear(lm(fo, mydata)), colour="black", size = 5, parse=TRUE)
linplot1
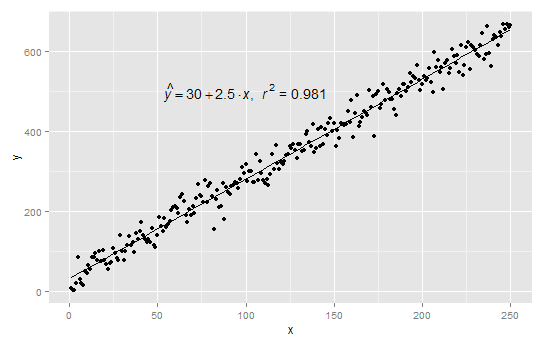 |
| Regression Line |