In this tutorial, we will cover how to run two sample t-test with R.
Introduction : Significance Testing
You have a sample data and you are asked to assess the credibility of a statement about population. Statistical significance evaluates the likelihood that an observed difference is due to chance.
It deals with the following questions :
The independent t test evaluates whether the means for two independent groups are significantly different from each other. It is used for just 2 groups of samples. If you have more than 2 groups of samples, you should use ANOVA. For example, if we compare mean salary of male and female employees and check whether there is a statistical significant difference between the mean salary between them.
Assumptions of Independent Sample T-Test
Dependent (or Paired) Two Sample T-Test
The paired t test compares the means of two groups that are correlated. In other words, it evaluates whether the means for two paired groups are significantly different from each other. This paired t-test is used in ‘before-after’ studies, or 'case-control' studies. Example, if we give training to students about R-Programming language and we want to see whether or not the training had any impact on the students' score on R-programming test, we could use the paired sample test.
Assumptions of Paired T-Test
Type I and II Errors
Case Study [Independent Sample T-Test]
Of year 2009 Psychology major students, each student in a random sample of 200 students was asked how many statistics classes they were enrolled in.
Of year 2015 Psychology major students, each student in a random sample of 200 students was asked how many statistics classes they were enrolled in.
We wanted to see whether the mean number of enrollment in statistics classes has changed over the past 6 years.
Solution : Independent T-Test
Null Hypothesis
It is a statement that you want to test. It usually states that there is no relationship between the two variables.
In this case, the null hypothesis states that there is no difference between the mean number of enrollment in statistics classes in 2009 and 2015 batch.
Alternate Hypothesis
It is contrary to the null hypothesis. It usually states that there is a relationship between the two variables.
In this case, the alternate hypothesis states that there is a difference between the mean number of enrollment in statistics classes in 2009 and 2015 batch.
Create Sample Data in R
R Code : Two Sample Ttest
Should i check Assumption : Equality Of Variance?
Run T-test of Equal Variance :
 |
| Two Sample Ttest with R |
You have a sample data and you are asked to assess the credibility of a statement about population. Statistical significance evaluates the likelihood that an observed difference is due to chance.
It deals with the following questions :
If we selected many samples from the same population, would we still find the same relationship between these two variables in every sample? Or is our finding due only to random chance?Independent Two Sample T-Test
The independent t test evaluates whether the means for two independent groups are significantly different from each other. It is used for just 2 groups of samples. If you have more than 2 groups of samples, you should use ANOVA. For example, if we compare mean salary of male and female employees and check whether there is a statistical significant difference between the mean salary between them.
Assumptions of Independent Sample T-Test
- Each score is sampled independently and randomly.
- The scores are normally distributed within each of the two groups.
- The variance in each of the groups is equal.
Mathematical Formula
 |
| Two Sample t-test Formula |
x1-bar and x2-bar are sample means and sample sizes : n1 and n2. Unknown population means- mu1-bar and mu2-bar. s1 and s2 are sample standard deviations.
The paired t test compares the means of two groups that are correlated. In other words, it evaluates whether the means for two paired groups are significantly different from each other. This paired t-test is used in ‘before-after’ studies, or 'case-control' studies. Example, if we give training to students about R-Programming language and we want to see whether or not the training had any impact on the students' score on R-programming test, we could use the paired sample test.
Assumptions of Paired T-Test
- Only the paired groups can be used to perform the paired test.
- Each score is sampled independently and randomly.
- The scores are normally distributed within each of the two groups.
- The variance in each of the groups is equal.
Type I and II Errors
 |
| Hypothesis Testing : Type I and II Errors |
Of year 2009 Psychology major students, each student in a random sample of 200 students was asked how many statistics classes they were enrolled in.
Of year 2015 Psychology major students, each student in a random sample of 200 students was asked how many statistics classes they were enrolled in.
Solution : Independent T-Test
Since students from batch of 2009 and 2015 are not same, we should use Independent T-test rather than Paired T-test.
Null Hypothesis
It is a statement that you want to test. It usually states that there is no relationship between the two variables.
In this case, the null hypothesis states that there is no difference between the mean number of enrollment in statistics classes in 2009 and 2015 batch.
Alternate Hypothesis
It is contrary to the null hypothesis. It usually states that there is a relationship between the two variables.
In this case, the alternate hypothesis states that there is a difference between the mean number of enrollment in statistics classes in 2009 and 2015 batch.
1. Define Sample I
batch2009 <- c(rep(1,14), rep(2,48), rep(3,60), rep(4,38), rep(5,26), rep(6,14))
table(batch2009)
2. Define Sample II
batch2015 <- c(rep(1,20), rep(2,32), rep(3,60), rep(4,40), rep(5,26), rep(6,22))
table(batch2015)
Visualize Groups
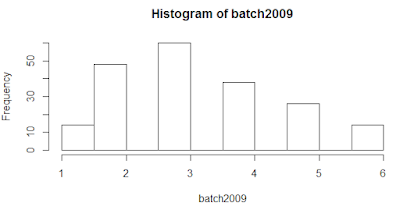 |
| Sample I Data |
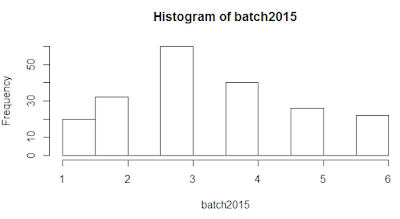 |
| Sample II Data |
R Code : Two Sample Ttest
t.test(batch2009, batch2015, var.equal=FALSE)
When the var.equal argument is set to FALSE in the above syntax, it runs Welch's two sample t-test.
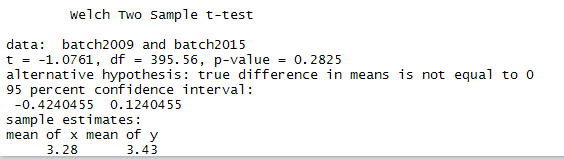 |
| Welch Two Sample T-test |
Since p-value is greater than 0.05, it means we fail to reject the null hypothesis. It implies there is no significant difference between the mean number of enrollment in statistics class in batch 2009 and batch 2015.
Most of the stats textbooks recommends we should first test the assumption that variances are equal with Levene’s test. However, most of the whitepapers proves that in simulation of several studies, levene’s test fails to reject the null-hypothesis that variances are equal even when variances are unequal. Hence, we should always use Welch's two sample t-test.
Welch's t-test performs better than Student's t-test whenever sample sizes and variances are unequal between groups, and gives the same result when sample sizes and variances are equal.In case you are interested to run Levene Test for Equality of Variance, check the following program :
temp = rbind(data.frame(x=batch2009, group=1), data.frame(x=batch2015, group=2))In this example, the significance (p value) of Levene's test is 0.2003. Since this value is greater than 5% level of significance (0.05), we fail to reject the null hypothesis that the variability of the two groups is equal, implying that the variances are unequal.
temp$group = as.factor(temp$group)
library(car)
leveneTest(temp$x, group = temp$group, center = mean)
Run T-test of Equal Variance :
t.test(batch2009, batch2015, var.equal=TRUE)
It returns the same result as shown above in the Welch's Sample T-test result.
How to calculate t-test and p-value manually
How to calculate t-test and p-value manually
xhat1 <- mean(batch2009)
xhat2 <- mean(batch2015)
s1 <- sd(batch2009)
s2 <- sd(batch2015)
n1 <- length(batch2009)
n2 <- length(batch2015)
diff_in_means <- xhat1 - xhat2
SE_diff_mean <- sqrt(s1^2/n1+s2^2/n2)
t_stat <- diff_in_means/SE_diff_mean
t_stat
pvalue = 2* pt(t_stat, df=n1+n2-2)
pvalue