The first step of building a predictive model is to define a target variable. For that we need to define the observation and performance window.
Factors in choosing Observation Window
Rolling Performance Window
Why Rolling Performance Window
If you are building a campaign response model, campaign data of multiple periods should be considered.
Observation Window
It is the period from where independent variables /predictors come from. In other words, the independent variables are created considering this period (window) only.
Performance Window
It is the period from where dependent variable /target come from. It is the period following the observation window.
Example
Suppose you are developing a customer attrition model for retail bank customers. 'Customer attrition' means customers are leaving the bank. You have historical data from Jan'13 to Dec'15. To create independent variables / predictors, data from Jan'13 to May'15 would be used. Customers who attrited during July'15 - Dec'15 are considered as attritors (or events) in the model. One month lag between observation and performance window would be used as a period during which the population will be scored when implementing the model.
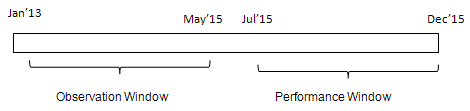 |
| Observation and Performance Window |
Factors in choosing Observation Window
1. Take into enough cases to develop a model.
2. Take into account any seasonal influences.
3. No fixed window for all the models. Depends on the type of model.
Factors in choosing Performance Window
1. Performance window depends on the model you are building. In other words, it depends on the definition of product. For example, performance window for customer attrition for savings product model would be different than performance window for Certificate of Deposit model.
1. Performance window depends on the model you are building. In other words, it depends on the definition of product. For example, performance window for customer attrition for savings product model would be different than performance window for Certificate of Deposit model.
2. Initially take multiple length of the performance windows and calculate event rate against these periods. Select the period at which event rate stabilizes.
Rolling Performance Window
It implies taking multiple windows to build a model but the duration of performance window is fixed as shown in the image below.
 |
| Rolling Performance Window |
Why Rolling Performance Window
1. Seasonality
It is not always a case that the behavior of attributes of customers are constant. For example, the attrition rate of a particular period is 10%. In the other period, it may go up or down. There could be some seasonality related to it. When we take a single performance window, we assume that the variables are constant over time. When we take multiple performance window, we capture seasonality in the model.
2. Including Multiple Campaigns
Example : Campaign Response - Rolling Performance Windows
- Customers targeted in Jan 2015 for the home loan campaign–whether the customers have taken the loan from Feb 2015 to April 2015
- Customers targeted in Feb 2015 for the home loan campaign–whether the customers have taken the loan converted from March 2015 to May 2015
- Customers targeted in March 2015 for the home loan campaign–whether the customers have taken the loan from April 2015 to June 2015