This tutorial explains how to call or run R code from SAS environment. Both SAS and R are leaders in statistical analysis tools for analytics industry. Both the tools have its own advantages and disadvantages. Life would be very easy if we can integrate R with SAS. SAS officially made it possible to run R code via PROC IML. But PROC IML is a paid SAS module which causes user to incur additional cost. R comes with a strong list of machine learning / text mining packages and advanced graphic capabilities which makes it stand apart from SAS. For example, you are asked to forecast 5 years sales. In SAS, you have to purchase SAS ETS module for forecasting procedures such as Proc ARIMA, Proc Forecast etc. In R, forecasting package is available for free and more powerful than SAS forecasting procedures.
 |
| Run R from SAS |
Steps to integrate R with SAS
Step 1 : Download Proc_R Code
Step 2 : Save the file in desired location.
Step 3 : Open the code and update the path of R executable file in the code below.
%macro quit(rpath=%str(C:\Progra~1\R\R-3.3.1\bin\R.exe))Note : Make sure you use 'Progra~1' instead of 'Program Files' in the path. For example, my R executable file is saved in this path - C:\Program Files\R\R-3.3.1\bin\R.exe but i used this path - C:\Progra~1\R\R-3.3.1\bin\R.exe
Step 4 : Open Base SAS and call proc_R macro. Replace the existing path in the code with your own path where you have saved proc_R code.
%include "C:\Users\Deepanshu\Desktop\proc_R.sas";Step 5 : Run R inside SAS environment. See the SAS program below -
%Proc_R(SAS2R=,R2SAS=);
cards4;
/********/
/*R Code*/
/********/
;;;;
%quit;
Proc_R Parameters
- SAS2R - specifies the names of SAS datasets to be converted to R dataframe. Can be single file name or multiple files whose names are separated by space.
- R2SAS - specifies the names of R data frames to be converted to SAS datasets. Can be single file name or multiple files whose names are separated by space.
Examples : Proc_R
Create a sample data
data example;Example 1 : Calculating Summary Statistics
input Srl x1-x5;
cards;
1 . 89 85 . 87
2 79 73 74 . .
3 80 82 . 85 .
;
run;
The following program first exports input data in CSV format and R code. Then it imports CSV data from the working directory into R and run the code you put inside %proc_R. Later it exports R log, data frame and image which are later imported in SAS. Here, we are telling SAS to integrate with R to calculate summary statistics on example dataset.
%include "C:\Users\Deepanshu\Desktop\proc_R.sas";Note : It is required to set the working directory with setwd() function. Update your directory in the setwd() function.
/*Run Summary Statistics*/
%Proc_R(SAS2R=example,R2SAS=);
cards4;
setwd("C:/Users/Deepanshu/Documents")
summary(example)
;;;;
%quit;
proc print data=rlog;
run;
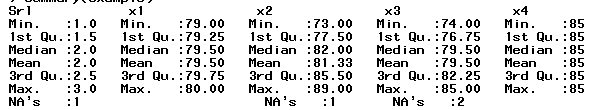 |
| Summary displayed in SAS result window |
The output shown in the image above is a truncated one as the real output is large in size.
Example 2 : Data Manipulation with dplyr Package
In the program below, we are loading dplyr library and calculating first non-missing record in each row. The calculation would be done in R and later SAS exports dataframe df.
%Proc_R(SAS2R=example,R2SAS=df);
cards4;
setwd("C:/Users/Deepanshu/Documents")
library(dplyr)
df = mutate(example,nonmiss=coalesce(x1,x2,x3,x4,x5))
;;;;
%quit;
Example3 : Creating Bar Chart
The following code creates a bar chart in R and later displayed in SAS Results Viewer.
%Proc_R(SAS2R=,R2SAS=);
cards4;
setwd("C:/Users/Deepanshu/Documents")
mydata = sample(LETTERS[1:5],16,replace = TRUE)
mydata.count= table(mydata)
barplot(mydata.count)
colors = c("red", "yellow", "green", "violet", "orange", "blue", "pink", "cyan")
barplot(mydata.count, col=colors, main="Main Title ", xlab="X-Axis Title")
;;;;
%quit;
Example 4 : Build ARIMA Model in R
data arimaexample;
input sales @@;
cards;
360358357
374371385
385389398
400412424
418412408
420424438
435438446
451456470
457448440
456457469
473477483
490498503
;
run;
%Proc_R(SAS2R=arimaexample,R2SAS=Forecastmodel);
cards4;
setwd("C:/Users/Deepanshu/Documents")
library(forecast)
# Convert it to ts object
dat = data.frame(arimaexample)
tsdata = ts(dat)
# Plot time series data
plot.ts(tsdata)
tsdisplay(tsdata)
# Box lambda Transformation
lambda = BoxCox.lambda(tsdata)
#lambda close to 1 means no transformation required
tsdata2 = BoxCox(tsdata, lambda=lambda)
plot.ts(tsdata2)
# Unit Ratio Tests
library(tseries)
adf = adf.test(tsdata2)
kpss = kpss.test(tsdata2)
# Number of Difference Required to make data stationary
ndiffs(tsdata2)
tsdata3 = diff(tsdata2, differences = 1)
final = auto.arima(tsdata, trace= TRUE, ic ="bic", approximation = FALSE, stepwise = FALSE)
# predict the next 5 periods
Forecastmodel = forecast.Arima(final, h = 5)
;;;;
%quit;
proc print data= rlog;
run;
Example 5 : Supports Multiple datasets / dataframes
In the macro, we can also specify multiple SAS datasets or data frames. In the code below, we have specified multiple SAS datasets that would be imported into R and then perform some calculation and later multiple R data frames would be exported.
%Proc_R(SAS2R=example arimaexample,R2SAS= df1 df2);
cards4;
setwd("C:/Users/Deepanshu/Documents")
df1=data.frame(mean(as.numeric(arimaexample$sales)))
df2=data.frame(sum(is.na(example)))
;;;;
%quit;
proc print data = df1;
proc print data = df2;
run;