In this article, we will cover how K-nearest neighbor (KNN) algorithm works and how to run k-nearest neighbor in R. It is one of the most widely used algorithm for classification problems.
Introduction to K-Nearest Neighbor (KNN)
 |
| K-Nearest Neighbor Simplified |
Introduction to K-Nearest Neighbor (KNN)
Knn is a non-parametric supervised learning technique in which we try to classify the data point to a given category with the help of training set. In simple words, it captures information of all training cases and classifies new cases based on a similarity.
Predictions are made for a new instance (x) by searching through the entire training set for the K most similar cases (neighbors) and summarizing the output variable for those K cases. In classification this is the mode (or most common) class value.
How KNN algorithm works
Suppose we have height, weight and T-shirt size of some customers and we need to predict the T-shirt size of a new customer given only height and weight information we have. Data including height, weight and T-shirt size information is shown below -
| Height (in cms) | Weight (in kgs) | T Shirt Size |
|---|---|---|
| 158 | 58 | M |
| 158 | 59 | M |
| 158 | 63 | M |
| 160 | 59 | M |
| 160 | 60 | M |
| 163 | 60 | M |
| 163 | 61 | M |
| 160 | 64 | L |
| 163 | 64 | L |
| 165 | 61 | L |
| 165 | 62 | L |
| 165 | 65 | L |
| 168 | 62 | L |
| 168 | 63 | L |
| 168 | 66 | L |
| 170 | 63 | L |
| 170 | 64 | L |
| 170 | 68 | L |
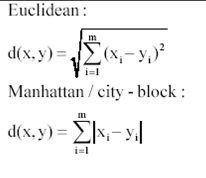
Step 1 : Calculate Similarity based on distance function
There are many distance functions but Euclidean is the most commonly used measure. It is mainly used when data is continuous. Manhattan distance is also very common for continuous variables.
 |
| Distance Functions |
The idea to use distance measure is to find the distance (similarity) between new sample and training cases and then finds the k-closest customers to new customer in terms of height and weight.
New customer named 'Monica' has height 161cm and weight 61kg.
Euclidean distance between first observation and new observation (monica) is as follows -
=SQRT((161-158)^2+(61-58)^2)Similarly, we will calculate distance of all the training cases with new case and calculates the rank in terms of distance. The smallest distance value will be ranked 1 and considered as nearest neighbor.
Step 2 : Find K-Nearest Neighbors
Let k be 5. Then the algorithm searches for the 5 customers closest to Monica, i.e. most similar to Monica in terms of attributes, and see what categories those 5 customers were in. If 4 of them had ‘Medium T shirt sizes’ and 1 had ‘Large T shirt size’ then your best guess for Monica is ‘Medium T shirt. See the calculation shown in the snapshot below -
 |
| Calculate KNN manually |
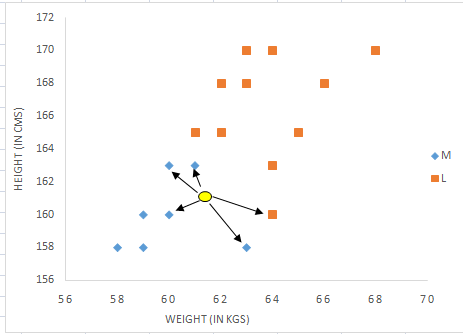
In the graph below, binary dependent variable (T-shirt size) is displayed in blue and orange color. 'Medium T-shirt size' is in blue color and 'Large T-shirt size' in orange color. New customer information is exhibited in yellow circle. Four blue highlighted data points and one orange highlighted data point are close to yellow circle. so the prediction for the new case is blue highlighted data point which is Medium T-shirt size.
 |
| KNN: Visual Representation |
Assumptions of KNN
1. Standardization
When independent variables in training data are measured in different units, it is important to standardize variables before calculating distance. For example, if one variable is based on height in cms, and the other is based on weight in kgs then height will influence more on the distance calculation. In order to make them comparable we need to standardize them which can be done by any of the following methods :
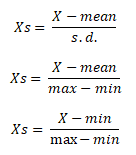 |
| Standardization |
2. Outlier
Low k-value is sensitive to outliers and a higher K-value is more resilient to outliers as it considers more voters to decide prediction.
Why KNN is non-parametric?
Non-parametric means not making any assumptions on the underlying data distribution. Non-parametric methods do not have fixed numbers of parameters in the model. Similarly in KNN, model parameters actually grows with the training data set - you can imagine each training case as a "parameter" in the model.
KNN vs. K-mean
Many people get confused between these two statistical techniques- K-mean and K-nearest neighbor. See some of the difference below -
- K-mean is an unsupervised learning technique (no dependent variable) whereas KNN is a supervised learning algorithm (dependent variable exists)
- K-mean is a clustering technique which tries to split data points into K-clusters such that the points in each cluster tend to be near each other whereas K-nearest neighbor tries to determine the classification of a point, combines the classification of the K nearest points
Yes, K-nearest neighbor can be used for regression. In other words, K-nearest neighbor algorithm can be applied when dependent variable is continuous. In this case, the predicted value is the average of the values of its k nearest neighbors.
Pros and Cons of KNN
Pros
- Easy to understand
- No assumptions about data
- Can be applied to both classification and regression
- Works easily on multi-class problems
Cons
- Memory Intensive / Computationally expensive
- Sensitive to scale of data
- Not work well on rare event (skewed) target variable
- Struggle when high number of independent variables
For any given problem, a small value of k will lead to a large variance in predictions. Alternatively, setting k to a large value may lead to a large model bias.
How to handle categorical variables in KNN?
Create dummy variables out of a categorical variable and include them instead of original categorical variable. Unlike regression, create k dummies instead of (k-1). For example, a categorical variable named "Department" has 5 unique levels / categories. So we will create 5 dummy variables. Each dummy variable has 1 against its department and else 0.
How to find best K value?
Cross-validation is a smart way to find out the optimal K value. It estimates the validation error rate by holding out a subset of the training set from the model building process.
Cross-validation (let's say 10 fold validation) involves randomly dividing the training set into 10 groups, or folds, of approximately equal size. 90% data is used to train the model and remaining 10% to validate it. The misclassification rate is then computed on the 10% validation data. This procedure repeats 10 times. Different group of observations are treated as a validation set each of the 10 times. It results to 10 estimates of the validation error which are then averaged out.
K Nearest Neighbor in R
We are going to use historical data of past win/loss statistics and the corresponding speeches. This dataset comprises of 1524 observations on 14 variables. Dependent variable is win/loss where 1 indicates win and 0 indicates loss. The independent variables are:
1.Proportion of words in the speech showing
a.Optimism
b.Pessimism
c.the use of Past
d.the use of Present
e.the use of Future
2.Number of time he/she mentions his/her own party
3.Number of time he/she mentions his/her opposite parties.
4.Some measure indicating the content of speech showing
a.Openness
b.Conscientiousness
c.Extraversion
d.Agreeableness
e.Neuroticism
f.emotionality
Download Link :Data File
Read Data
# Read data
data1 = read.csv("US Presidential Data.csv")
View(data1)
We read the CSV file with the help of read.csv command. Here the first argument is the name of the dataset. The second argument - Header = TRUE or T implies that the first row in our csv file denotes the headings while header = FALSE or F indicates that the data should be read from the first line and does not involves any headings.
# load library
library(caret)
library(e1071)
# Transforming the dependent variable to a factor
data1$Win.Loss = as.factor(data1$Win.Loss)
Here we will use caret package in order to run knn. Since my dependent variable is numeric here thus we need to transform it to factor using as.factor().
Firstly we set the seed to be 101 so that the same results can be obtained. In the createDataPartition() the first argument is the dependent variable , p denotes how much data we want in the training set; here we take 70% of the data in training set and rest in cross validation set, list = F denotes that the indices we obtain should be in form of a vector.
#Partitioning the data into training and validation data
set.seed(101)
index = createDataPartition(data1$Win.Loss, p = 0.7, list = F )
train = data1[index,]
validation = data1[-index,]
In order to partition the data into training and validation sets we use createDataPartition() function in caret.
# Explore data
dim(train)
dim(validation)
names(train)
head(train)
head(validation)
The dimensions of training and validation sets are checked via dim(). See first 6 rows of training dataset -
   Win.Loss   Optimism  Pessimism  PastUsed FutureUsed PresentUsed OwnPartyCount
1        X1 0.10450450 0.05045045 0.4381443  0.4948454  0.06701031             2
3        X1 0.11257190 0.04930156 0.4159664  0.5168067  0.06722689             1
5        X1 0.10582640 0.05172414 0.3342618  0.5821727  0.08356546             3
7        X1 0.09838275 0.06401617 0.3240741  0.6018519  0.07407407             6
9        X1 0.10610734 0.04688464 0.3633540  0.5372671  0.09937888             2
10       X1 0.10066128 0.05951506 0.3554817  0.5382060  0.10631229             1
   OppPartyCount NumericContent Extra Emoti Agree Consc Openn
1              2    0.001877543 4.041 4.049 3.469 2.450 2.548
3              1    0.002131163 3.463 4.039 3.284 2.159 2.465
5              4    0.002229220 4.658 4.023 3.283 2.415 2.836
7              4    0.002251985 3.727 4.108 3.357 2.128 2.231
9              5    0.002446440 4.119 4.396 3.661 2.572 2.599
10             2    0.002107436 3.800 4.501 3.624 2.117 2.154
By default, levels of dependent variable in this dataset is "0""1". Later when we will do prediction, these levels will be used as variable names for prediction so we need to make it valid variable names.
# Setting levels for both training and validation data
levels(train$Win.Loss) <- make.names(levels(factor(train$Win.Loss)))
levels(validation$Win.Loss) <- make.names(levels(factor(validation$Win.Loss)))
Here we are using repeated cross validation method using trainControl . Number denotes either the number of folds and ‘repeats’ is for repeated ‘r’ fold cross validation. In this case, 3 separate 10-fold validations are used.
# Setting up train controls
repeats = 3
numbers = 10
tunel = 10
set.seed(1234)
x = trainControl(method = "repeatedcv",
number = numbers,
repeats = repeats,
classProbs = TRUE,
summaryFunction = twoClassSummary)
Using train() function we run our knn; Win.Loss is dependent variable, the full stop after tilde denotes all the independent variables are there. In ‘data=’ we pass our training set, ‘method=’ denotes which technique we want to deploy, setting preProcess to center and scale tells us that we are standardizing our independent variables
center : subtract mean from values.
scale : divide values by standard deviation.
trControl demands our ‘x’ which was obtained via train( ) and tunelength is always an integer which is used to tune our algorithm.
model1 <- train(Win.Loss~. , data = train, method = "knn",
preProcess = c("center","scale"),
trControl = x,
metric = "ROC",
tuneLength = tunel)# Summary of modelmodel1plot(model1)
k-Nearest Neighbors

1068 samples
  13 predictor
   2 classes: 'X0', 'X1'

Pre-processing: centered (13), scaled (13)
Resampling: Cross-Validated (10 fold, repeated 3 times)
Summary of sample sizes: 961, 962, 961, 962, 961, 962, ...
Resampling results across tuning parameters:

  k   ROC        Sens       Spec
   5  0.8440407  0.6910182  0.8382051
   7  0.8537506  0.6847658  0.8520513
   9  0.8575183  0.6712350  0.8525796
  11  0.8588422  0.6545296  0.8592152
  13  0.8585478  0.6560976  0.8556333
  15  0.8570397  0.6432249  0.8648329
  17  0.8547545  0.6448509  0.8627894
  19  0.8520574  0.6336043  0.8632867
  21  0.8484632  0.6215447  0.8627894
  23  0.8453320  0.6071622  0.8658664

ROC was used to select the optimal model using the largest value.
The final value used for the model was k = 11.
 |
| Cross Validation : Fine Tuning |
# Validation
valid_pred <- predict(model1,validation, type = "prob")
#Storing Model Performance Scores
library(ROCR)
pred_val <-prediction(valid_pred[,2],validation$Win.Loss)
# Calculating Area under Curve (AUC)
perf_val <- performance(pred_val,"auc")
perf_val
# Plot AUC
perf_val <- performance(pred_val, "tpr", "fpr")
plot(perf_val, col = "green", lwd = 1.5)
#Calculating KS statistics
ks <- max(attr(perf_val, "y.values")[[1]] - (attr(perf_val, "x.values")[[1]]))
ks
The Area under curve (AUC) on validation dataset is 0.8642.