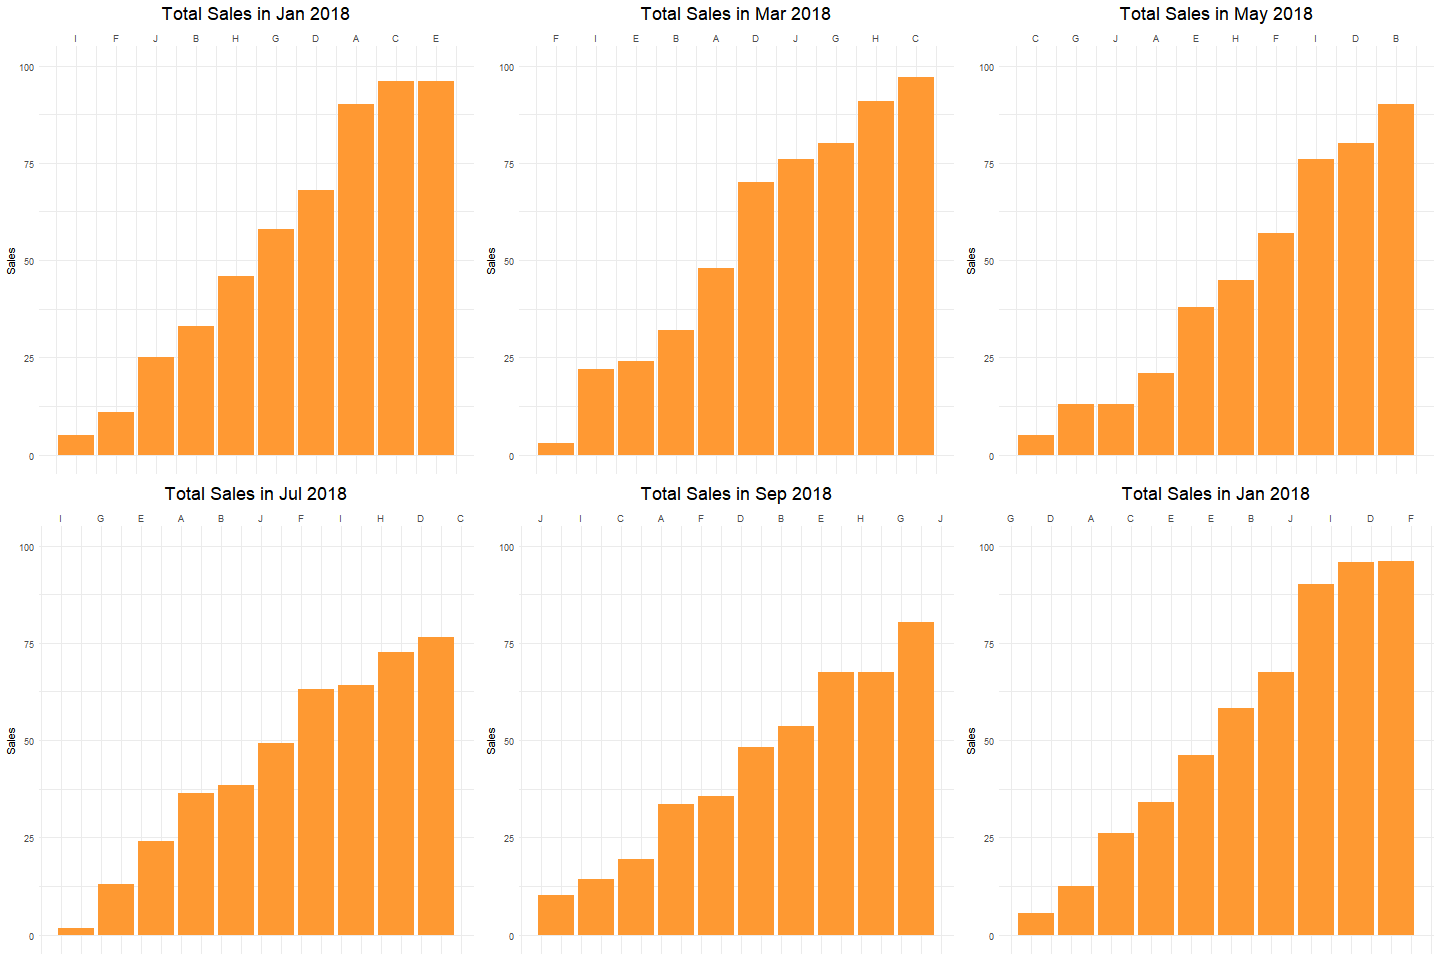
This tutorial covers various ways you can create animated charts or plots using R. Animation is a very important element of data visualization. Animated charts are visually appealing and it fetches attention of audience. There are many online data visualization tools available in market which can generate animated charts but most of them are paid tools. Also problem with the online animation tools is that it asks you to upload data to their server, which is a data breach if you work on a real-world data of your client. Since R is open-source, you can download it for free and can create animated charts without moving data to server of any external server.
In this example, we will create bar chart showing change in monthly sales figure of different products.
Simple Animation in R
Let's create dummy data for illustration. In the program below, we are generating 3 columns containing some random observations. First column named A contains 50 observations ranging from 1 to 75. Similarly second column contains similar number of observations but range interval is different.df = data.frame(A=sample(1:75, 50, replace=TRUE),
B=sample(1:100, 50, replace=TRUE),
stringsAsFactors = FALSE)
gganimate package is used for animation in R. It is an extension of popular package for graphics - ggplot2 package. library(ggplot2)
library(tidyverse)
library(gganimate)
library(directlabels)
library(png)
library(transformr)
library(grid)
ggplot(df, aes(A, B)) +
geom_line() +
transition_reveal(A) +
labs(title = 'A: {frame_along}')
geom_line() is used for creating line chart. transition_reveal(A) allows you to let data gradually appear.frame_along gives the position that the current frame corresponds to. What is frame and rendering in animation?
In animation, a frame is one of the many still images which compose the complete moving picture. Rendering is a kind of computing to output the final result. In gganimate package, it is by default100 frames to render. You can change the number of frames under nframes= parameter in animatefunction. p = ggplot(df, aes(A, B, group = C)) +
geom_line() +
transition_reveal(A) +
labs(title = 'A: {frame_along}')
animate(p, nframes=40)
How to save animated plot in GIF format file?
You can useanim_save(file_location,plot) function to export animated chart in GIF format. anim_save("basic_animation.gif", p)
Frames per Second (fps)
It is the amount of time spend on each frame per second. You can use parameterfps in animate() function. By default, it is 10 frames per second. animate(p, nframes=40, fps = 2)
Decreasing fps from 10 means slowing down speed of animation.
How to stop loop in animation?
Loop means continuously repeating animation over and over again. To end loop, you can userenderer = gifski_renderer(loop = FALSE) option in animate function. animate(p, renderer = gifski_renderer(loop = FALSE))
How to change layout of plot?
You can change height and width of plot by mentioning the size inanimate( ) function. animate(p, fps = 10, duration = 14, width = 800, height = 400)
Advanced Animation in R : Examples
Prepare Data for ExampleIn this example, we will create bar chart showing change in monthly sales figure of different products.
set.seed(123)
dates = paste(rep(month.abb[1:10], each=10), 2018)
df = data.frame(Product=rep(sample(LETTERS[1:10],10), 10),
                Period=factor(dates, levels=unique(dates)),
                Sales=sample(1:100,100, replace = TRUE))
head(df)
  Product   Period Sales order
1       E Jan 2018    15     1
2       H Jan 2018    34     2
3       F Jan 2018    42     3
4       E Jan 2018    49     4
5       J Jan 2018    49     5
6       C Jan 2018    60     6
# Ranking by Period and SalesDetailed Explanation
df = df %>%
arrange(Period, Sales) %>%
mutate(order = 1:n())
# Animation
p = df %>%
ggplot(aes(order, Sales)) +
geom_bar(stat = "identity", fill = "#ff9933") +
labs(title='Total Sales in {closest_state}', x=NULL) +
theme(plot.title = element_text(hjust = 0.5, size = 18)) +
scale_x_continuous(breaks=df$order, labels=df$Product, position = "top") +
transition_states(Period, transition_length = 1, state_length = 2) +
view_follow(fixed_y=TRUE) +
ease_aes('cubic-in-out')
animate(p, nframes=50, fps=4)
anim_save("bar_animation.gif", p)
transition_states()animates plot by categorical or discrete variable. "States" are the animation sequences which plays. When a state transition is triggered, there will be a new state whose animation sequence will then run. In this case, state isPeriodcolumn.state_lengthrefers to relative length of the pause at the states.transition_lengthrefers to relative length of the transition.view_follow(fixed_y=TRUE)means y-axis would be fixed when animation is running.ease_aes( )refers to motion in animation that starts quickly and then decelerates. Or vice-versa.- You can set theme using
theme_set(theme_minimal())
Indian General Election (1984 to 2019) Study
Recently BJP secured majority in Lok Sabha Election. In 1984, they contested first time in Lok Sabha Election. INC (Indian National Congress) used to be the biggest political party in India a decade ago. Here we will see the trend analysis on "% of seats won by these two parties) from 1984 to 2019. Source of Data : Election Commission of Indialibrary(ggplot2)
library(tidyverse)
library(gganimate)
library(directlabels)
library(png)
library(transformr)
library(grid)
# Read Data
df = read.table(text =
" Year Perc_Seats Party
1984 0.79 INC
1989 0.38 INC
1991 0.45 INC
1996 0.27 INC
1998 0.27 INC
1999 0.22 INC
2004 0.28 INC
2009 0.4 INC
2014 0.09 INC
2019 0.1 INC
1984 0 BJP
1989 0.17 BJP
1991 0.23 BJP
1996 0.31 BJP
1998 0.35 BJP
1999 0.35 BJP
2004 0.27 BJP
2009 0.23 BJP
2014 0.52 BJP
2019 0.56 BJP
", header=TRUE)
# Set Theme
theme_set(theme_minimal())
# Plot and animate
p =
ggplot(data = df, aes(x= factor(Year), y=Perc_Seats, group=Party, colour=Party)) +
geom_line(size=2, show.legend = FALSE) +
scale_color_manual(values=c("#ff9933", "#006400")) +
scale_x_discrete(position = "top") +
scale_y_continuous(labels = scales::percent_format(accuracy = 1)) +
labs(title = 'Lok Sabha Election : % of seats won',
x = NULL, y = NULL) +
geom_text(aes(label=scales::percent(Perc_Seats, accuracy = 1),
vjust= -2), show.legend = FALSE) +
theme(plot.title = element_text(hjust = 0.5)) +
geom_dl(aes(label=Party), method="last.points") +
transition_reveal(Year) +
coord_cartesian(clip = 'off') +
ease_aes('cubic-in-out')
animate(p, fps = 10, width = 800, height = 400)
anim_save("election.gif", p)
How to save animated plot as video
Make sureffmpeg is installed on your system before using the code below. It is available for download for all the operating systems.
animate(nations_plot, renderer = ffmpeg_renderer(), width = 800, height = 450)
anim_save("nations.mp4")


