This tutorial explains the concept of vintage analysis and how it is used in banking. Vintage analysis is also called 'cohort' analysis. ![]() Let's understand the table above
Let's understand the table above![]()
![]()
![]()
Introduction to Vintage Analysis
In credit risk, it is a popular method for managing credit risk. The term 'Vintage' refers to the month or quarter in which account was opened (loan was granted). In simple words, the vintage analysis measures the performance of a portfolio in different periods of time after the loan (or credit card) was granted. Performance can be measured in the form of cumulative charge-off rate, proportion of customers 30/60/90 days past due (DPD), utilization ratio, average balance etc.The vintage analysis is used for a variety of purposes. Some of them are listed below -
- Identify if accounts opened in a particular month or quarter are riskier than others
- Determine the optimal period of performance window in development of scorecard
- Monitor or track risk of a portfolio
- Estimate minimum months required after that we can cross-sell to new customers
- Forecast risk
- Can be used in stress testing
How Vintage Analysis is used in credit risk modeling?
It is used to determine the number of months' data you should consider for performance window. If customer defaults (90 days or more past due) during the performance window, borrower would be considered as a 'bad' customer and labeled as 'event' in dependent variable.To do this process, we first need to take multiple periods. Let's take 6 different time periods for demonstration -
- 36 months window starting from Q1,2016. Q1,2016 is the period when accounts were opened and we would see their performance in the next 36 months.
- 30 months window starting from Q3,2016. Why 30 months? For accounts opened in 3rd quarter of 2016, we only have 30 months of data.
- 24 months window starting from Q1,2017
- 18 months window starting from Q3,2017
- 12 months window starting from Q1,2018
- 6 months window starting from Q3,2018

In the first row, it shows 1.1% of customers who opened their account in first quarter of 2016 were 90 days past due after 15 months. Similarly, 2.5% of accounts opened in the first quarter of 2017 turned out to be bad customer after 21 months.For graphical representation, let's plot this data in line chart and see the growth trend of bad rate.
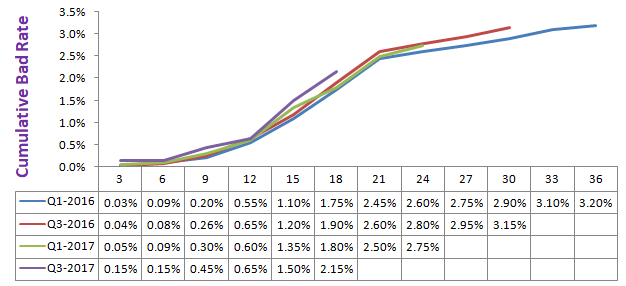
The chart above shows the bad rate growing at a fast pace before 24 months and then stabilize after 24 months. Hence we can use 24 months as a time period for performance window.
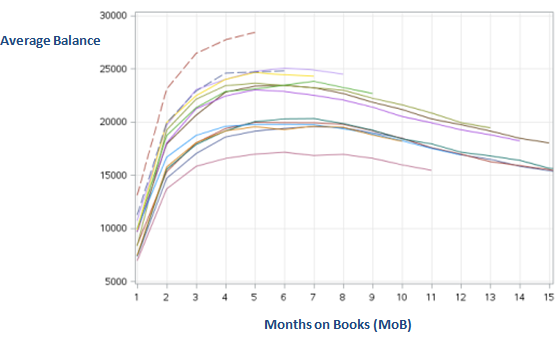
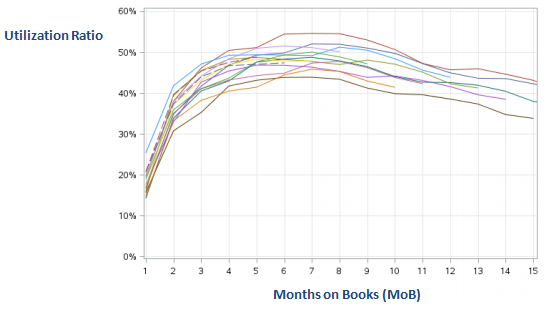
Trend Analysis
We can also analyse trend using Vintage Analysis. For example, average balance for customers opened in different quarters and see their trend in the subsequent months after account opening date. In the charts shown below, we are showing vintage analysis of average balance and utilization ratio. The variable reaches maximum in 6-7 months and after that it starts decreasing.