This tutorial explains when, why and how to standardize a variable in statistical modeling. Variable Standardization is one of the most important concept of predictive modeling. It is a preprocessing step in building a predictive model. Standardization is also called Normalization and Scaling.
Standardization / Scaling
The concept of standardization comes into picture when continuous independent variables are measured at different scales. It means these variables do not give equal contribution to the analysis. For example, we are performing customer segmentation analysis in which we are trying to group customers based on their homogenous (similar) attributes. A variable called 'transaction amount' that ranges between $100 and $10000 carries more weightage as compared to a variable i.e. number of transactions that in general ranges between 0 and 30. Hence, it is required to transform the data to comparable scales. The idea is to rescale an original variable to have equal range and/or variance.
0 0 1 1
3. Standard Deviation Method
In this method, we divide each value by the standard deviation. The idea is to have equal variance, but different means and ranges. Formula : x/stdev(x)
4. Range Method
In this method, we dividing each value by the range. Formula : x /(max(x) - min(x)). In this case, the means, variances, and ranges of the variables are still different, but at least the ranges are likely to be more similar.
var_x2 = 0.08833861
What is Centering?
Centering means subtracting a constant value from every value of a variable. The constant value can be average, min or max. Most of the times we use average value to subtract it from every value.
When it is important to standardize variables?
1. It is important to standardize variables before running Cluster Analysis. It is because cluster analysis techniques depend on the concept of measuring the distance between the different observations we're trying to cluster. If a variable is measured at a higher scale than the other variables, then whatever measure we use will be overly influenced by that variable.
2. Prior to Principal Component Analysis, it is critical to standardize variables. It is because PCA gives more weightage to those variables that have higher variances than to those variables that have very low variances. In effect the results of the analysis will depend on what units of measurement are used to measure each variable. Standardizing raw values makes equal variance so high weight is not assigned to variables having higher variances.
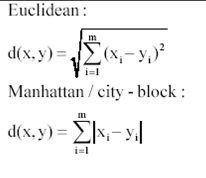
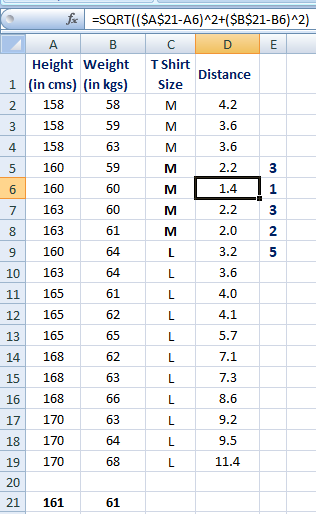
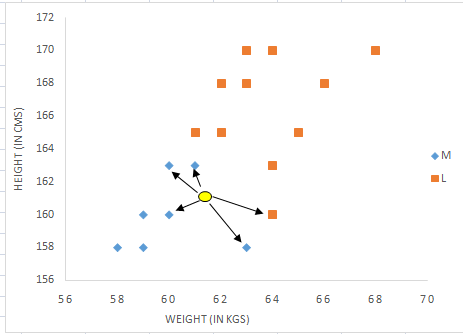
3. It is required to standardize variable before using k-nearest neighbors with an Euclidean distance measure. Standardization makes all variables to contribute equally.
4. All SVM kernel methods are based on distance so it is required to scale variables prior to running final Support Vector Machine (SVM) model.
5. It is necessary to standardize variables before using Lasso and Ridge Regression. Lasso regression puts constraints on the size of the coefficients associated to each variable. However, this value will depend on the magnitude of each variable. The result of centering the variables means that there is no longer an intercept. This applies equally to ridge regression.
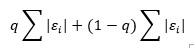
6. In regression analysis, we can calculate importance of variables by ranking independent variables based on the descending order of absolute value of standardized coefficient.
7. In regression analysis, when an interaction is created from two variables that are not centered on 0, some amount of collinearity will be induced. Centering first addresses this potential problem. In simple terms, having non-standardized variables interact simply means that when X1 is big, then X1X2 is also going to be bigger on an absolute scale irrespective of X2, and so X1 and X1X2 will end up correlated.
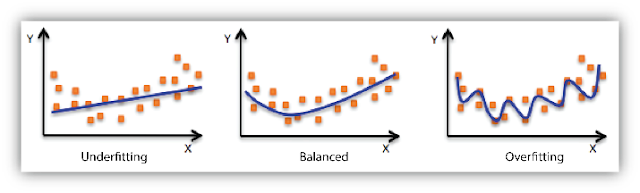
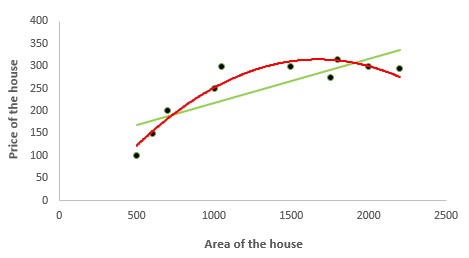
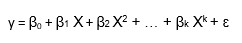
8. In regression analysis, it is also helpful to standardize a variable when you include power terms X². Standardization removes collinearity.
When it is not required to standardize variables
1. If you think model performance of linear regression model would improve if you standardize variables, it is absolutely incorrect! It does not change RMSE, R-squared value, Adjusted R-squared value, p-value of coefficients. See the detailed R script below. It shows standardization does not affect model performance at all.
Without Standardization -
Coefficients:
Estimate Std. Error t value Pr(>|t|)
(Intercept) 1.216e+00 9.732e-01 1.25 0.212
X1 1.984e+00 1.089e-02 182.19 <2e-16 ***
X2 3.000e-02 2.188e-05 1371.21 <2e-16 ***
X3 -4.990e+02 1.070e+00 -466.21 <2e-16 ***
---
Signif. codes: 0 ‘***’ 0.001 ‘**’ 0.01 ‘*’ 0.05 ‘.’ 0.1 ‘ ’ 1
Residual standard error: 9.849 on 996 degrees of freedom
Multiple R-squared: 0.9995,Adjusted R-squared: 0.9995
F-statistic: 6.799e+05 on 3 and 996 DF, p-value: < 2.2e-16
Estimate Std. Error t value Pr(>|t|)
(Intercept) 598.4244 0.3114 1921.4 <2e-16 ***
X1 57.0331 0.3130 182.2 <2e-16 ***
X2 428.6441 0.3126 1371.2 <2e-16 ***
X3 -145.8587 0.3129 -466.2 <2e-16 ***
---
Signif. codes: 0 ‘***’ 0.001 ‘**’ 0.01 ‘*’ 0.05 ‘.’ 0.1 ‘ ’ 1
Residual standard error: 9.849 on 996 degrees of freedom
Multiple R-squared: 0.9995,Adjusted R-squared: 0.9995
F-statistic: 6.799e+05 on 3 and 996 DF, p-value: < 2.2e-16
Compare Coefficients, R-Squared and Adjusted R-Squared
How to standardize validation / test dataset
To standardize validation and test dataset, we can use mean and standard deviation of independent variables from training data. Later we apply them to test dataset using Z-score formula. See the formula below -
Interpretation of Standardized Regression Coefficient
Correlation with or without Centering / Standardization
The correlation score does not change if you perform correlation analysis on centered and uncentered data.
Standardize Binary (Dummy) Variables
Standardization / Scaling
The concept of standardization comes into picture when continuous independent variables are measured at different scales. It means these variables do not give equal contribution to the analysis. For example, we are performing customer segmentation analysis in which we are trying to group customers based on their homogenous (similar) attributes. A variable called 'transaction amount' that ranges between $100 and $10000 carries more weightage as compared to a variable i.e. number of transactions that in general ranges between 0 and 30. Hence, it is required to transform the data to comparable scales. The idea is to rescale an original variable to have equal range and/or variance.
 |
| Standardization / Scaling |
Methods of Standardization / Normalization
There are main four methods of standardization. They are as follows -
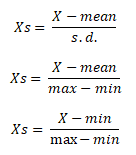
Z score standardization is one of the most popular method to normalize data. In this case, we rescale an original variable to have a mean of zero and standard deviation of one.
Mathematically, scaled variable would be calculated by subtracting mean of the original variable from raw vale and then divide it by standard deviation of the original variable.
R Code : Standardize a variable using Z-score
There are main four methods of standardization. They are as follows -
1. Z score
Z score standardization is one of the most popular method to normalize data. In this case, we rescale an original variable to have a mean of zero and standard deviation of one.
 |
| Z score |
R Code : Standardize a variable using Z-score
# Creating a sample data
set.seed(123)
X =data.frame(k1 = sample(100:1000,1000, replace=TRUE),
k2 = sample(10:100,1000, replace=TRUE))
X.scaled = scale(X, center= TRUE, scale=TRUE)
In scale() function, center= TRUE implies subtracting the mean from its original variable. The scale = TRUE implies dividing the centered column by its standard deviations.
It is also called 0-1 scaling because the standardized value using this method lies between 0 and 1.
The formula is shown below -
Check Mean and Variance of Standardized Variable
colMeans(X.scaled)
Result : 0 for both k1 and k2
var(X.scaled)
Result : 1 for both k1 and k2
Interpretation
A value of 1 implies that the value for that case is one standard deviation above the mean, while a value of -1 indicates that a case has a value one standard deviations lower than the mean.
Important Point
The standardized values do not lie in a particular interval. It can be any real number.
2. Min-Max Scaling
It is also called 0-1 scaling because the standardized value using this method lies between 0 and 1.
The formula is shown below -
x-min(x)/(max(x)-min(x))This method is used to make equal ranges but different means and standard deviations.
library(dplyr)
mins= as.integer(summarise_all(X, min))
rng = as.integer(summarise_all(X, function(x) diff(range(x))))
X.scaled = data.frame(scale(X, center= mins, scale=rng))
Check Min and Max of standardized variables
summarise_all(X.scaled, funs(min, max))k1_min k2_min k1_max k2_max
0 0 1 1
3. Standard Deviation Method
In this method, we divide each value by the standard deviation. The idea is to have equal variance, but different means and ranges. Formula : x/stdev(x)
X.scaled = data.frame(scale(X, center= FALSE , scale=apply(X, 2, sd, na.rm = TRUE)))Check Equal Variance
summarise_all(X.scaled, var)Result : 1 for both the variables
4. Range Method
In this method, we dividing each value by the range. Formula : x /(max(x) - min(x)). In this case, the means, variances, and ranges of the variables are still different, but at least the ranges are likely to be more similar.
library(dplyr)var_x1 = 0.08614377
rng = as.integer(summarise_all(X, function(x) diff(range(x))))
X.scaled = data.frame(scale(X, center= FALSE, scale=rng))
summarise_all(X.scaled, var)
var_x2 = 0.08833861
What is Centering?
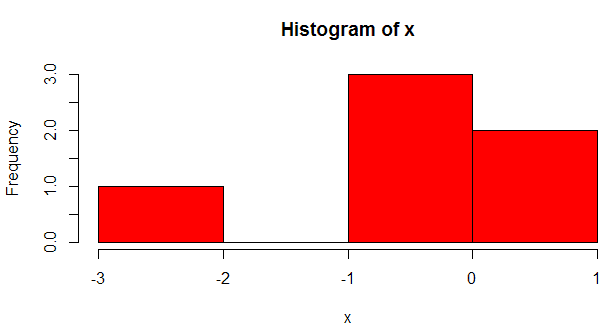
Centering means subtracting a constant value from every value of a variable. The constant value can be average, min or max. Most of the times we use average value to subtract it from every value.
X=sample(1:100,1000, replace=TRUE)
scale(X,center = TRUE, scale=FALSE)
By default, scale() function with center=TRUE subtract mean value from values of a variable.
When it is important to standardize variables?
1. It is important to standardize variables before running Cluster Analysis. It is because cluster analysis techniques depend on the concept of measuring the distance between the different observations we're trying to cluster. If a variable is measured at a higher scale than the other variables, then whatever measure we use will be overly influenced by that variable.
2. Prior to Principal Component Analysis, it is critical to standardize variables. It is because PCA gives more weightage to those variables that have higher variances than to those variables that have very low variances. In effect the results of the analysis will depend on what units of measurement are used to measure each variable. Standardizing raw values makes equal variance so high weight is not assigned to variables having higher variances.
3. It is required to standardize variable before using k-nearest neighbors with an Euclidean distance measure. Standardization makes all variables to contribute equally.
4. All SVM kernel methods are based on distance so it is required to scale variables prior to running final Support Vector Machine (SVM) model.
5. It is necessary to standardize variables before using Lasso and Ridge Regression. Lasso regression puts constraints on the size of the coefficients associated to each variable. However, this value will depend on the magnitude of each variable. The result of centering the variables means that there is no longer an intercept. This applies equally to ridge regression.
6. In regression analysis, we can calculate importance of variables by ranking independent variables based on the descending order of absolute value of standardized coefficient.
7. In regression analysis, when an interaction is created from two variables that are not centered on 0, some amount of collinearity will be induced. Centering first addresses this potential problem. In simple terms, having non-standardized variables interact simply means that when X1 is big, then X1X2 is also going to be bigger on an absolute scale irrespective of X2, and so X1 and X1X2 will end up correlated.
8. In regression analysis, it is also helpful to standardize a variable when you include power terms X². Standardization removes collinearity.
When it is not required to standardize variables
1. If you think model performance of linear regression model would improve if you standardize variables, it is absolutely incorrect! It does not change RMSE, R-squared value, Adjusted R-squared value, p-value of coefficients. See the detailed R script below. It shows standardization does not affect model performance at all.
Without Standardization -
# Create Sample Data
set.seed(123)
train <- data.frame(X1=sample(1:100,1000, replace=TRUE),
X2=1e2*sample(1:500,1000, replace=TRUE),
X3=1e-2*sample(1:100,1000, replace=TRUE))
train$y <- with(train,2*X1 + 3*1e-2*X2 - 5*1e2*X3 + 1 + rnorm(1000,sd=10))
#Fit linear regression model
fit <- lm(y~X1+X2+X3,train)
summary(fit)
Coefficients:
Estimate Std. Error t value Pr(>|t|)
(Intercept) 1.216e+00 9.732e-01 1.25 0.212
X1 1.984e+00 1.089e-02 182.19 <2e-16 ***
X2 3.000e-02 2.188e-05 1371.21 <2e-16 ***
X3 -4.990e+02 1.070e+00 -466.21 <2e-16 ***
---
Signif. codes: 0 ‘***’ 0.001 ‘**’ 0.01 ‘*’ 0.05 ‘.’ 0.1 ‘ ’ 1
Residual standard error: 9.849 on 996 degrees of freedom
Multiple R-squared: 0.9995,Adjusted R-squared: 0.9995
F-statistic: 6.799e+05 on 3 and 996 DF, p-value: < 2.2e-16
# create test datasetWith Standardization
test <- data.frame(X1=sample(-5:5,100,replace=TRUE),
X2=1e2*sample(-5:5,100, replace=TRUE),
X3=1e-2*sample(-5:5,100, replace=TRUE))
# predict y based on test data without standardization
pred <- predict(fit,newdata=test)
# Standardize predictors
means <- sapply(train[,1:3],mean)
stdev <- sapply(train[,1:3],sd)
train.scaled <- as.data.frame(scale(train[,1:3],center=means,scale=stdev))
head(train.scaled)
train.scaled$y <- train$y
# Check mean and Variance of Standardized VariablesResult : Mean is 0 and Variance is 1 for all the standardized variables
library(dplyr)
summarise_at(train.scaled, vars(X1,X2,X3), funs(round(mean(.),4)))
summarise_at(train.scaled, vars(X1,X2,X3), var)
#Fit Scaled DataCoefficients:
fit.scaled <- lm(y ~ X1 + X2 + X3, train.scaled)
summary(fit.scaled)
Estimate Std. Error t value Pr(>|t|)
(Intercept) 598.4244 0.3114 1921.4 <2e-16 ***
X1 57.0331 0.3130 182.2 <2e-16 ***
X2 428.6441 0.3126 1371.2 <2e-16 ***
X3 -145.8587 0.3129 -466.2 <2e-16 ***
---
Signif. codes: 0 ‘***’ 0.001 ‘**’ 0.01 ‘*’ 0.05 ‘.’ 0.1 ‘ ’ 1
Residual standard error: 9.849 on 996 degrees of freedom
Multiple R-squared: 0.9995,Adjusted R-squared: 0.9995
F-statistic: 6.799e+05 on 3 and 996 DF, p-value: < 2.2e-16
The value of coefficients are not same when we run regression analysis with and without standardizing independent variables. It does not mean they are affected by scaling / standardization. The values are different because of these are the slopes - how much the target variable changes if you change independent variable by 1 unit. In other words, standardization can be interpreted as scaling the corresponding slopes. The adjusted r-squared and multiple r-squared value is exactly same.
How to standardize validation / test dataset
To standardize validation and test dataset, we can use mean and standard deviation of independent variables from training data. Later we apply them to test dataset using Z-score formula. See the formula below -
Z = (X_test - Xbar_training) / Stdev_trainingR Script - Standardize Test Data
test.scaled <- as.data.frame(scale(test,center=means,scale=stdev))Compare Prediction and RMSE
head(test.scaled)
# predict y based on new data scaled, with fit from scaled datasetRMSE is same in both the cases 9.829196. It is because RMSE is associated with scale of Y (target variable). Prediction is also unchanged.
pred.scaled <- predict(fit.scaled,newdata=test.scaled)
# Compare Prediction - unscaled vs. scaled fit
all.equal(pred,pred.scaled)
# RMSE on train data with un-scaled fit
pred_train <- predict(fit,newdata=train)
rmse <- sqrt(mean((train$y - pred_train)^2))
# RMSE on train data with scaled fit
pred_train.scaled <- predict(fit.scaled,newdata=train.scaled)
rmse.scaled <- sqrt(mean((train$y - pred_train.scaled)^2))
# Compare RMSE
all.equal(rmse,rmse.scaled)
Interpretation of Standardized Regression Coefficient
Most of modern statistical softwares automatically produces standardized regression coefficient. It is important metrics to rank predictors. Its interpretation is slightly different from unstandardized estimates. Standardized coefficients are interpreted as the number of standard deviation units Y changes with an increase in one standard deviation in X.
Correlation with or without Centering / Standardization
The correlation score does not change if you perform correlation analysis on centered and uncentered data.
X=sample(1:100,1000, replace=TRUE)
Y=1e2*sample(1:500,1000, replace=TRUE)
cor(X,Y)
cor(X-mean(X),Y-mean(X))
Standardization after missing imputation and outlier treatment
Centering and Scaling data should be done after imputing missing values. It is because the imputation could influence correct center and scale to use. Similarly, outlier treatment should be done prior to standardization.
Standardize Binary (Dummy) Variables
- Standardizing binary variables makes interpretation of binary variables vague as it cannot be increased by a standard deviation. The simplest solution is : not to standardize binary variables but code them as 0/1, and then standardize all other continuous variables by dividing by two standard deviation. It would make them approximately equal scale. The standard deviation of both the variables would be approx. 0.5
- Some researchers are in favor of standardizing binary variables as it would make all predictors on same scale. It is a standard practice in penalized regression (lasso). In this case, researchers ignore the interpretation of variables.
Standardization and Tree Algorithms and Logistic Regression
Standardization does not affect logistic regression, decision tree and other ensemble techniques such as random forest and gradient boosting.