Quantcast
Viewing all 425 articles
Browse latest View live

Stop SAS Macro on Error

This tutorial explains how to make SAS stop macro execution on error. It is one of the most common task in building a macro. For example, you are building a macro for SAS users who are beginners. You need to make sure error handling in the macro. If user forgets to specify either a dataset name or variable name, macro should not execute further steps and it should abort immediately.


1. Stop Macro Processing on Error

In the following program, we are telling SAS to stop sas code if user does not specify parameters and notifying them what they have missed. The %abort cancel; statement tells SAS to abort execution immediately.
%macro explore(inputdata= ,var=);
options notes;
%if %length(&inputdata) = 0 %then %do;
%put ERROR: INPUTDATA= must be specified;
%put ERROR: The macro ended abnormally.;
%abort cancel;
%end;

%if %length(&var) = 0 %then %do;
%put ERROR: VAR= must be specified;
%put ERROR: The macro ended abnormally.;
%abort cancel;
%end;

proc sort data = &inputdata.;
by &var.;
run;

%mend;

%explore(inputdata =  , var = age );
Logic - If the length of string of a macro parameter is 0, it means the macro parameter is blank.

2. Go to End of Program If Error

In the following program, we are telling SAS to go to end of the code if error comes, The %goto statement is used to jump to end of the program.
%macro explore(inputdata= ,var=);
options notes;
%if %length(&inputdata) = 0 %then %do;
%put ERROR: INPUTDATA= must be specified;
%put ERROR: The macro ended abnormally.;
%goto exit;
%end;

%if %length(&var) = 0 %then %do;
%put ERROR: VAR= must be specified;
%put ERROR: The macro ended abnormally.;
%goto exit;
%end;

proc sort data = &inputdata.;
by &var.;
run;

%exit:
%mend;

%explore(inputdata = , var = age );
3. Check for Error after each step of SAS Code

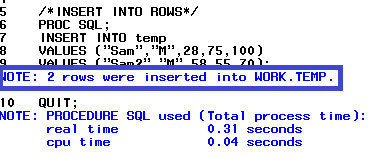
Sometimes we make typo while entering dataset or variable name. It is important to handle these kinds of errors as well so we need to check for error(s) after each step of SAS Code (Data Step, PROCs).  %if &syserr. ne 0 %then %do; works for it.
%macro explore(inputdata= ,var=);
options notes;
%if %length(&inputdata) = 0 %then %do;
%put ERROR:INPUTDATA= must be specified;
%put ERROR: The macro ended abnormally.;
%abort cancel;
%end;
%if %length(&var) = 0 %then %do;
%put ERROR: VAR= must be specified;
%put ERROR: The macro ended abnormally.;
%abort cancel;
%end;
proc sort data = &inputdata.;
by &var.;
run;
%if &syserr. ne 0 %then %do;
%abort cancel;
%end;

%mend;
%explore(inputdata = sashelp.clss , var = age );
Tip

Instead of using %length to calculate the length of macro parameter, we can use COUNTW function. It is very useful to count the number of variables in the macro parameter.

%if %sysfunc(countw(&inputdata., %str( ))) = 0 %then %do;
%abort cancel;
%end;


PROC SQL : ALTER TABLE and UPDATE COLUMN

This tutorial explains how to add or delete columns in a table and update column values with PROC SQL.
The ALTER TABLE statement is used to add new columns, delete existing columns or modifying the format of columns.
The UPDATE statement is used to modify existing column values in a table.
Create a Dataset
data temp;
set sashelp.class;
run;

ALTER TABLE Syntax
ALTER TABLE table-name
ADD CONSTRAINT constraint-name constraint-definition
ADD column-definition
DROP CONSTRAINT constraint-name
DROP column(s)
DROP FOREIGN KEY constraint-name
DROP PRIMARY KEY
MODIFY column-definition

Example 1 : Adding Columns

In the following program, we are adding 3 columns - Section as character variable, TotalMarks as numeric variable, DateOfBirth as Date format variable. The new columns would be blank.
PROC SQL;
ALTER TABLE temp ADD Section CHAR (10), TotalMarks NUM (8),
DateOfBirth num informat=date7. format=date7.;
QUIT;
Image may be NSFW.
Clik here to view.
ALTER Table : Add Columns

Example 2 : Add Values in New Columns

The UPDATE statement is used to add or update values in columns. In this case, we are updating rows wherein age is less than 15.
PROC SQL;
UPDATE temp SET Section='Section A', TotalMarks=100, DateOfBirth='22OCT99'D where age < 15;
QUIT;
Image may be NSFW.
Clik here to view.
Update Columns

Example 3 : Conditional Update Statement

We are adding 5 to column Height if age is less than or equal to 15. If age is greater than 15, height should be added by 10. In other words, we are using IF THEN ELSE conditions in UPDATE statement.
PROC SQL;
UPDATE temp
SET Height =
CASE WHEN age <= 15 THEN Height + 5
WHEN age > 15 THEN Height + 10
ELSE HEIGHT
END;

QUIT;
Example 4 : Update Multiple Columns

We can update multiple columns with UPDATE statement like the programs written below -
PROC SQL;
ALTER TABLE temp ADD min_age num , min_height num;
UPDATE temp
SET min_age = (SELECT MIN(age) FROM temp2),
min_height = (SELECT MIN(height) FROM temp2); 

QUIT;
PROC SQL;
UPDATE temp SET Section='SectionB', DateOfBirth='22OCT02'D where age<15;
UPDATE temp SET Section='SectionA', DateOfBirth='22OCT99'D where age>=15;

QUIT;
Example 5 : Modify the column attributes

We can modify the column format with MODIFY statement.
PROC SQL;
ALTER TABLE temp
MODIFY totalmarks DECIMAL(8,2) format=8.2;quit;
Example 6 : Delete Columns
PROC SQL;
ALTER TABLE temp DROP totalmarks, section;
QUIT;
Example 7 : Adding NOT NULL Constraint

We are preventing missing values in a column using NOT NULL Contraint.
PROC SQL;
ALTER TABLE TEMP
ADD CONSTRAINT NOT_NULL_WEIGHT NOT NULL(WEIGHT);QUIT;
Example 8 : Adding CHECK Constraint

We are validating column values with CHECK constraint.See the example below -
PROC SQL;
ALTER TABLE PRODUCTS
ADD CONSTRAINT CHECK_SECTION
CHECK (SECTION IN ('Section A', 'Section B'));
QUIT;
Example 9 : Allowing only UNIQUE values

We are not allowing duplicate values in a column.
PROC SQL;
CREATE TABLE TEMP3
(ID NUM UNIQUE,
STATE CHAR(20));
QUIT;
Example 10 : Creating a Primary Key

The PRIMARY KEY constraint uniquely identifies each record in a table.
PROC SQL;
ALTER TABLE TEMP3
ADD CONSTRAINT PRIM_KEY PRIMARY KEY (ID);
QUIT;

Related Article : How to Insert Rows with PROC SQL 

PROC SQL : INSERT INTO

This tutorial explains how to insert or add rows in the same table. It can be easily done with INSERT INTO statement of PROC SQL.

Create a dataset
data temp;
set sashelp.class;
run;
1. Insert Rows based on Column Position

With the VALUES clause and INSERT statement, we can assign values to columns by their positions. In the example below, "Sam" would be added to the first column, "M" added to the second column, "28" added to the third column and so on. Multiple VALUES clauses implies multiple rows to be added into the table.
PROC SQL;
INSERT INTO temp
VALUES ("Sam","M",28,75,100)
VALUES ("Sam2","M",58,55,70);

QUIT;
See the log shown in the image below - 
Image may be NSFW.
Clik here to view.
Log : Inserting Rows
2. Insert Rows based on Column Name

We can also define columns and values assigned to them only. Values of all the columns that are not defined would be assigned missing.
PROC SQL;
INSERT INTO temp (name,sex)
VALUES ("Sam","M");
QUIT;
Image may be NSFW.
Clik here to view.
Insert Rows based on Column Name

3. Insert Rows with a Query

We can also add rows with a query. In the example below, we are appending rows to the table by extracting data from the other table.
proc sql;
insert into newclass
select * from class
where score > 150;
quit;
4. Create Sample Data with PROC SQL

The DATALINES statement with an INPUT statement in DATA STEP is used to read data that you enter directly in the program. In PROC SQL, you can do the same with CREATE TABLE and INSERT INTO statement.
proc sql;
create table list
(ID num(10), Gender char(1),Salary num,
DateOfBirth num informat=date7. format=date7.);
insert into list
values(12345,'F',42260,'21JAN01'd)
values(23456,'M',61090,'26JAN54'd);
quit;
Image may be NSFW.
Clik here to view.
DATALINES in PROC SQL
5. Add Constraints in the Table

We are adding constraints that values of ID variable should be unique (Primary Key), "area" variable contain only two values - USA and India, samplesize should be greater than 0.
proc sql;
create table example
(ID num(15),
samplesize num,
area  char(15) NOT NULL,
constraint prim_key    primary key(ID),
constraint samplesize  check(samplesize gt 0),
constraint area   check(area in ('USA', 'India')));
quit;
Let's insert two rows
proc sql;
insert into example
values(12345,42260,'India')
values(12345,61090,'USA');
quit;
It returns error due to duplicate values in a variable that have a constraint of primary key.
Image may be NSFW.
Clik here to view.
Error Due to Duplicate Values

6. Create a blank table

We can create a blank table by copying the structure of existing table
PROC SQL;
CREATE TABLE EXAMPLE2 LIKE TEMP;
QUIT;

7. See the structure of table

The DESCRIBE table is an alternative to PROC CONTENTS. It displays the structure of table - how table was created and format of variables.
PROC SQL;
DESCRIBE TABLE EXAMPLE2;
QUIT;

Related Article : How to Alter Table and Update Column 

SAS : Convert Character Variable to Date

This tutorial explains multiple ways we can convert character variable to SAS date.
Suppose you encounter a problem in which you need to convert character variable to SAS date format. It happens most of the times when we upload raw data file in TXT, EXCEL or CSV format to SAS. The problem with dates in character format is you cannot apply any calculations on them.
Create a Sample Data
data example;
input dateofbirth $20.;
cards;
05/11/1980
07/05/1990
04/14/1981
;
run;
Convert Character Variable to SAS Date

The INPUT function is used to convert character variable to numeric. With MMDDYY10. format, we assign format of the date.
data out;
set example;
dateofbirth2 = input(strip(dateofbirth),MMDDYY10.);
format dateofbirth2 MMDDYY10.;
run;
Important Note : Please make sure a new variable is created for conversion. If you use the same variable for conversion, the format of the variable would remain character.

Image may be NSFW.
Clik here to view.
Output : Convert Character Variable to Date

Convert Multiple Character Variables to Date

Suppose you need to convert multiple character variables to SAS datevalue format. We can create SAS array to convert them.
data example2;
input dateofbirth $10. hire $11.;
cards;
1971-11-21 1991-12-21
1980-05-14 1999-10-20
;
run;
Real SAS Date values are numeric so numeric array is created for them.
data out;
set example2;
array olddates $ dateofbirth hire;
array newdates dt1 dt2;
do i = 1 to dim(olddates);
newdates(i) = input(strip(olddates(i)),yymmdd10.);
end;
drop i;
format dt1-dt2 yymmdd10.;
run;
Image may be NSFW.
Clik here to view.
Array : Convert Character Variable to SAS Date

Advanced SAS Interview Questions and Answers

Knowing SAS is an asset in the job market as it holds largest job market share. I have listed down most frequently asked Advanced SAS Interview Questions and Answers. It covers topics on PROC SQL, SAS Macros, Advanced Data Manipulation case studies. These questions are best suited for interviews for SAS Developer, SAS Programmer role. It includes some common tricky and tough questions that are generally asked in an interview.

Part I : 50+ Base SAS Interview Questions and Answers

1. Two ways to select every second row in a data set
data example;
set sashelp.class;
if mod(_n_,2) eq 0;
run;
MOD Function returns the remainder from the division of the first argument by the second argument. _N_ corresponds to each row. The second row would be calculated like (2/2) which returns zero remainder.
data example1;
do i = 2 to nobs by 2;
set sashelp.class point=i nobs=nobs;
output;
end;
stop;
run;

2. How to select every second row of a group

Suppose we have a table sashelp.class. We want every second row by variable 'sex'.
proc sort data = sashelp.class;
by sex;
run;
data example2 (drop = N);
set sashelp.class;
by sex;
if first.sex then N = 1;
else N +1;
if N = 2 then output;
run;

3. How to calculate cumulative sum by group

Create Sample Data
data abcd;
input x y;
cards;
1 25
1 28
1 27
2 23
2 35
2 34
3 25
3 29
;
run; 
Image may be NSFW.
Clik here to view.
Cumulative Sum by Group
Cumulative Sum by X
data example3;
set abcd;
if first.x then z1 = y;
else z1 + y;
by x;
run;

4. Can both WHERE and IF statements be used for subsetting on a newly derived variable?
Image may be NSFW.
Clik here to view.
SAS : WHERE vs. IF
No. Only IF statement can be used for subsetting when it is based on a newly derived variable. WHERE statement would return an error "newly derived variable is not on file".

Please note that WHERE Option can be used for subsetting on a newly created variable.
data example4 (where =(z <=50));
set abcd;
z = x*y;
run;
5. Select the Second Highest Score with PROC SQL
data example5;
input Name $ Score;
cards;
sam 75
dave 84
sachin 92
ram 91
;
run;
proc sql;
select *
from example5
where score in (select max(score) from example5 where score not in (select max(score) from example5));
quit; 
6. Two ways to create a macro variable that counts the number of observations in a dataset

data _NULL_;
if 0 then set sashelp.class nobs=n;
call symputx('totalrows',n);
stop;
run;
%put nobs=&totalrows.;
proc sql;
select count(*) into: nrows from sashelp.class;
quit;
%put nobs=%left(&nrows.);

7. Suppose you have data for employees. It comprises of employees' name, ID and manager ID. You need to find out manager name against each employee ID.

Image may be NSFW.
Clik here to view.
SQL: Self Join
Create Sample Data
data example2;
input Name $ ID ManagerID;
cards;
Smith 123 456
Robert 456  .
William 222 456
Daniel 777 222
Cook 383 222
;
run;
SQL Self Join
proc sql;
create table want as
select a.*, b.Name as Manager
from example2 as a left join example2 as b
on a.managerid = b.id;
quit;

8.  Create a macro variable and store TomDick&Harry

Issue : When the value is assigned to the macro variable, the ampersand placed after TomDick may cause SAS to interpret it as a macro trigger and an warning message would be occurred.
%let x = %NRSTR(TomDick&Harry);
%PUT &x.;
%NRSTR function is a macro quoting function which is used to hide the normal meaning of special tokens and other comparison and logical operators so that they appear as constant text as well as to mask the macro triggers ( %, &).

9. Difference between %STR and %NRSTR
Both %STR and %NRSTR functions are macro quoting functions which are used to hide the normal meaning of special tokens and other comparison and logical operators so that they appear as constant text. The only difference is %NRSTR can mask the macro triggers ( %, &) whereas %STR cannot.

10. How to pass unmatched single or double quotations text in a macro variable
%let eg  = %str(%'x);
%let eg2 = %str(x%");
%put &eg;
%put &eg2;
If the argument to %STR or %NRSTR contains an single or double quotation mark or an unmatched open or close parenthesis, precede each of these characters with a % sign.

11. How can we use COUNTW function in a macro
%let cntvar = %sysfunc(countw(&nvar));
There are several useful Base SAS function that are not directly available in Macro, %Sysfunc enables those function to make them work in a macro.

12.
%let x=temp;
%let n=3;
%let x3=result;
%let temp3 = result2;
 What %put &&x&n; and %put &&&x&n; would return?
  1. &&x&n : Two ampersands (&&) resolves to one ampersand (&) and scanner continues and then N resolves to 3 and then &x3 resolves to result.
  2. &&&x&n :  First two ampersands (&&) resolves to & and then X resolves to temp and then N resolves to 3. In last, &temp3 resolves to result2.

    13. How to reference a macro variable in selection criteria
    Use double quotes to reference a macro variable in a selection criteria. Single quotes would not work.
    Image may be NSFW.
    Clik here to view.
    SAS : Reference Macro Variable

    14. How to debug %IF %THEN statements in a macro code
    MLOGIC option will display how the macro variable resolved each time in the LOG file as TRUE or FALSE for %IF %THEN.

    15. Difference between %EVAL and %SYSEVALF functions 

    Both %EVAL and %SYSEVALF are used to perform mathematical and logical operation with macro variables. %let last = %eval (4.5+3.2); returns error as %EVAL cannot perform arithmetic calculations with operands that have the floating point values. It is when the %SYSEVALF function comes into picture.
    %let last2 = %sysevalf(4.5+3.2);
    %put &last2;

    16. What would be the value of i after the code below completes
    data test;
    set temp;
    array nvars {3} x1-x3;
    do i = 1 to 3;
    if nvars{i} > 3 then nvars{i} =.;
    end;
    run;
    Answer is 4. It is because when the first time the loop processes, the value of count is 1; the second time, 2; and the third time, 3. At the beginning of the fourth iteration, the value of count is 4, which is found to be greater than the stop value of 3 so the loop stops. However, the value of i is now 4 and not 3, the last value before it would be greater than 3 as the stop value.

    17. How to compare two tables with PROC SQL

    The EXCEPT operator returns rows from the first query that are not part of the second query.
    proc sql;
    select * from newfile
    except
    select * from oldfile;
    quit;

    18. Selecting Random Samples with PROC SQL

    The RANUNI and OUTOBS functions can be used for selecting random samples. The RANUNI function is used to generate random numbers.
    proc sql outobs = 10;
    create table tt as
    select * from sashelp.class
    order by ranuni(1234);
    quit;
    19. How to use NODUPKEY with PROC SQL

    In PROC SORT, NODUPKEY option is used to remove duplicates based on a variable. In SQL, we can do it like this :
    proc sql noprint;
    create table tt (drop = row_num) as
    select *, monotonic() as row_num
    from readin
    group by name
    having row_num = min(row_num)
    order by ID;
    quit;

    20. How to make SAS stop macro processing on Error

    Check out this link -Stop SAS Macro on Error


    21. Count Number of Variables assigned in a macro variables
    %macro nvars (ivars);
    %let n=%sysfunc(countw(&ivars));
    %put &n;
    %mend;
    %nvars (X1 X2 X3 X4);

    22. Assign incremental value by group

    See the snapshot below -

    Image may be NSFW.
    Clik here to view.
    Advanced SAS Interview Questions
    Prepare Input Data
    data xyz;
    input x $;
    cards;
    AA
    AA
    AA
    BB
    BB
    ;
    run;

    SAS Code
    proc sql;
    select a.x, b.N from xyz a
    inner join
    (select x, monotonic() as N
    from (
    select distinct x
    from xyz)) b
    on a.x=b.x;
    quit;

    23. Prepare a Dynamic Macro with %DO loop

    Check out this link - Dynamic SAS Macro


    24. Write a SAS Macro to extract Variable Names from a Dataset
    *Selecting all the variables;
    proc sql noprint;
    select name into : vars separated by ""
    from dictionary.columns
    where LIBNAME = upcase("work")
    and MEMNAME = upcase("predata");
    quit;
    The DICTIONARY.COLUMNS contains information such as name, type, length, and format, about all columns in the table. LIBNAME : Library Name, MEMNAME : Dataset Name
    %put variables = &vars.;

    25. How would DATA STEP MERGE and PROC SQL JOIN works on the following datasets shown in the image below?
    Image may be NSFW.
    Clik here to view.
    Many to Many Merge
    The DATA step does not handle many-to-many matching very well. When we perform many to many merges. the result should be a cartesian (cross) product. For example, if there are three records that match from one contributing data set to two records from the other, the resulting data set should have 3 × 2 = 6 records. Whereas, PROC SQL creates a cartesian product in case of many to many relationship.

    Detailed Explanation -Many to Many Merge

    26. Two ways to create a blank table

    Copy structure of existing table
    PROC SQL;
    CREATE TABLE EXAMPLE2 LIKE TEMP;
    QUIT;
    Enforce FALSE condition in Selection Criteria
    PROC SQL NOPRINT;
    CREATE TABLE EXAMPLE2 AS
    SELECT * FROM TEMP
    WHERE 1=0;
    QUIT;
    27. How to insert rows in a table with PROC SQL


    28. Difference between %LOCAL and %GLOBAL
    %LOCAL is used to create a local macro variable during macro execution. It gets removed when macro finishes its processing.
    %GLOBAL is used to create a global macro variable and would remain accessible till the end of a session . It gets removed when session ends.

    29. Write a macro with CALL EXECUTE

    Detailed Explanation of CALL EXECUTE


    30. Write a macro to split data into N number of datasets

    Suppose you are asked to write a macro to split large data into 2 parts (not static 2). In the macro, user should have flexibility to change the number of datasets to be created.
    %macro split(inputdata=, noofsplits=2);
    data %do i = 1 %to &noofsplits.;
    split&i. %end;;
    retain x;
    set &inputdata. nobs=nobs;
    if _n_ eq 1 then do;
    if mod(nobs,&noofsplits.) eq 0
    then x=int(nobs/&noofsplits.);
    else x=int(nobs/&noofsplits.)+1;
    end;
    if _n_ le x then output split1;
    %do i = 2 %to &noofsplits.;
    else if _n_ le (&i.*x)
    then output split&i.;
    %end;
    run;
    %mend split;
    %split(inputdata=temp, noofsplits=2);

    31. Store value in each row of a variable into macro variables
    data _null_;
    set sashelp.class ;
    call symput(cats('x',_n_),Name);
    run;
    %put &x1. &x2. &x3.;
    The CATS function is used to concatenate 'x' with _N_ (row index number) and removes leading and trailing spaces to the result.

    Part I : 50+ Base SAS Interview Questions and Answers

    Count and Percentage in a Column Chart

    This tutorial explains how to create a column chart in which we can show both values and percentages.
    Image may be NSFW.
    Clik here to view.
    Value and Percentage in Same Column Chart

    Task
    Suppose you are asked to show both frequency and percentage distribution in the same bar or column chart.

    Input Data

    Input values are stored in range B3:D7 as shown in the image below. Column B contains labels, Column C and D contain count and percentages. 
    Image may be NSFW.
    Clik here to view.
    Input Data
    Download the workbook

    Steps to show Values and Percentage

    1. Select values placed in range B3:C6 and Insert a 2D Clustered Column Chart (Go to Insert Tab >> Column >> 2D Clustered Column Chart). See the image below
    Image may be NSFW.
    Clik here to view.
    Insert 2D Clustered Column Chart
    2. In cell E3, type =C3*1.15 and paste the formula down till E6
    Image may be NSFW.
    Clik here to view.
    Insert a formula
    3. In cell F3, type the following formula and paste the formula down till F6.
    =C3&CHAR(10)&" ("&TEXT(D3,"0%")&")"
    Image may be NSFW.
    Clik here to view.
    Formula to concatenate Value and Percentage

    4. Select Chart and click on "Select Data" button. Then click on Add button and Select E3:E6 in Series Values and Keep Series name blank.
    Image may be NSFW.
    Clik here to view.
    Select Data and Add Series
    5. In chart, select Second Bar (or Series 2 Bar) and right click on it and select Format Data Series and then check Secondary Axis under Plot Series On box in Series Options tab
    Image may be NSFW.
    Clik here to view.
    Format Data Series
    Image may be NSFW.
    Clik here to view.
    Change from Primary to Secondary Axis

    6. Select chart and click on Select Data button and select Series 2 and click on Edit button under Horizontal Axis Labels and then give reference F3:F6 in Axis Label Range.
    Image may be NSFW.
    Clik here to view.
    Change Horizontal Axis Labels
    7. Right Click on bar and click on Add Data Labels Button.

    8. Right Click on bar and click on Format Data Labels Button and then uncheck Value and Check Category Name.
    Image may be NSFW.
    Clik here to view.
    Format Data Labels

    9. Select Bar and make color No Fill ( Go to Format tab >> Under Shape Fill - Select No Fill)

    10. Select legends and remove them by pressing Delete key
    11. Select Secondary Axis and right click on it and select Format Axis >> Select None in all the 3 drop downs for tick mark and Axis labels (as shown in the image below)
    Image may be NSFW.
    Clik here to view.
    Make Tick Marks and Axis Labels None

    SAS Visual Analytics : Convert Numeric Variable to Date

    This post describes how to convert a numeric variable to date format in SAS Visual Analytics.

    Task
    Suppose a variable having date information is classified as a measure (numeric) variable type in SAS Visual Analytics . The task is to convert it to Date format variable.

    Solution
    We can create a new calculated data item using the TreatAs Numeric(advanced) operator.
    Step I
    Select Data >> New Calculated Item (See the image below)
    Image may be NSFW.
    Clik here to view.
    New Calculated Item
    Step II
    Enter a Name for the calculated item

    Step III

    Enter the TreatAs function under the 'Numeric(advanced)' section. In the image shown below, 'Period_Num' is the variable that we want to change it from numeric to date.

    Image may be NSFW.
    Clik here to view.
    SAS VA : Convert Numeric to Date

    Remove blank rows and columns in SAS VA Table

    This post describes how to edit or resize a table in SAS Visual Analytics. By default, SAS Visual Analytics adds unnecessary rows and columns in table. We generally need to remove these blank rows and columns from a table.
    Image may be NSFW.
    Clik here to view.
    Remove blank rows and columns

    1. Select the desired Section in which the table exists from the Properties tab.

    Image may be NSFW.
    Clik here to view.
    Properties Window

    2. Change Layout from Tiled to Precision.

    Image may be NSFW.
    Clik here to view.
    Change Layout

    3. Now you can resize table by selecting table's corners or edges to change the size.

    SAS Visual Analytics : Add Column Percentage in CrossTab

    This article explains how to add column percentage in crosstab in SAS Visual Analytics.

    Task
    Suppose you have created a cross tab - variable1 by variable2. You want to show both frequency and count % of column total. In SAS Visual Analytics, there is no direct way to show percentage of column total in crosstab.
    Image may be NSFW.
    Clik here to view.
    SAS VA : Crosstab
    Solution

    1. Add any measure variable that has no missing values.
    Image may be NSFW.
    Clik here to view.
    Add a measure variable

    2. Place your cursor to the column you have added and right click on it
    Image may be NSFW.
    Clik here to view.
    Add aggregated measure

    3. Select "Create and Add" and click on Percent of Subtotals.

    Image may be NSFW.
    Clik here to view.
    Add caption
    4. Check "Percent of Column total.

    5. Remove the added column and keep the percentage column.
    Image may be NSFW.
    Clik here to view.
    Final CrossTab Table


    Read ZIP or GZ Files in SAS

    This tutorial describes how to read or unzip .ZIP or .GZ files in SAS. When i tried to unzip files in SAS first time, i struggled a lot. It's a little bit tricky to read .GZ files into SAS directly.

    Steps to unzip GZ files in SAS

    1. Download GZIP software
    2. Extract file and copy path of gzip.exe
    3. Replace the highlighted line of code below with your path
    filename foo pipe '"C:\Users\Deepanshu\Downloads\gzip124xN\gzip.exe" -cd C:\Users\Deepanshu\Downloads\Newfolder\20090827.gz' ; 
    DATA mydata;
    INFILE foo dlm='|' lrecl=32767 dsd;
    length sym $ 10 se $ 2 cf $ 2;
    input sym $ se $ OP HP LP CP LTP TQ VS NT  cf$ ;
    RUN;
    If you encounter the following issues while importing zipped files in SAS, it means either you have not downloaded GZIP software or you have not assigned path of executable GZIP file.

    1. 'gzip' is not recognized as an internal or external command, operable program or batch file
    2. cannot locate the end of the central directory 


    Prior to SAS 9.4 :Steps to unzip ZIP files

    Download WINZIP software.

    The following example reads the cars.txt file from the cars.zip file.
    filename foo pipe '"C:\Users\Deepanshu\Winzip\winzip.exe" -o -c
                         c:\cars.zip   cars.txt' ;
    DATA mydata;
    INFILE foo dlm='|' lrecl=32767 dsd;
    length sym $ 10 se $ 2 cf $ 2;
    input sym $ se $ OP HP LP CP LTP TQ VS NT  cf$ ;
    RUN;
    SAS 9.4  : Steps to unzip ZIP files

    In SAS 9.4, FILENAME ZIP was introduced to read and import ZIP files.

    filename foo ZIP 'C:\cars.zip' member="cars.txt" ;
    DATA mydata;
    INFILE foo dlm='|' lrecl=32767 dsd;
    length sym $ 10 se $ 2 cf $ 2;
    input sym $ se $ OP HP LP CP LTP TQ VS NT  cf$ ;
    RUN;

    SAS : Read Character Variable of Varying Length

    This tutorial demonstrates how we can read or import data with a character variable of varying length. We generally encounter this situation when we have company names or both first and last names of a person in our dataset.

    Example I

    In the following example, the variable "Name" has varying length i.e. not all observations of this variable has similar length.

    Image may be NSFW.
    Clik here to view.
    Example Dataset
    Image may be NSFW.
    Clik here to view.
    Read Messy Data

    Method I : Use COLON Modifier

    We can use colon modifier : to tell SAS to read variable "Name" until there is a space or other delimiter. The  $30. defines the variable as a character variable having max length 30.
    data example1;
    input ID Name :$30. Score;
    cards;
    1 DeepanshuBhalla 22
    2 AttaPat 21
    3 XonxiangnamSamnuelnarayan 33
    ;
    proc print noobs;
    run;
    The colon modifier is also used to read numeric data that contains special characters such as comma For example 1,000.


    Method II : Use LENGTH statement prior to INPUT Statement

    In the following program, we use a length statement prior to input statement to adjust varying length of a variable. In this case, the variable Name would be read first. Use only $ instead of $30. after "Name" in INPUT statement.
    data example2;
    length Name $30.;
    input ID Name $ Score;
    cards;
    1 DeepanshuBhalla 22
    2 AttaPat 21
    3 XonxiangnamSamnuelnarayan 33
    ;
    proc print noobs;
    run;
    Image may be NSFW.
    Clik here to view.
    Output
    It changes the order of variables as the variable Name would be read first. 

    Method III : Use Ampersand (&) and Put Extra Space

    We can use ampersand (&) to tell SAS to read the variable until there are two or more spaces as a delimeter. This technique is very useful when the variable contains two or more words. For example, if we have observation like "Deepanshu Bhalla" rather than "DeepanshuBhalla".

    Note : 2 spaces before 22, 21 and 33
    data example1;
    input ID Name & $30. Score;
    cards;
    1 DeepanshuBhalla  22
    2 AttaPat  21
    3 XonxiangnamSamnuelnarayan  33
    ;
    proc print noobs;
    run;

    Example II : When a variable contains more than 1 word

    In this case, we have a space between First Name and Last Name and we want to store both the first and last names in a single variable.

    Image may be NSFW.
    Clik here to view.
    Example 2 : Read Messy Data

    In this case, the following methods do not work.

    1. Colon modifier (:) does not work for a variable having multiple words
    2.  LENGTH Statement prior to INPUT Statement does not work here.

    Use Ampersand (&) and add ADDITIONAL space works.
    data example1;
    input ID Name & $30. Score;
    cards;
    1 Deepanshu Bhalla  22
    2 Atta Pat  21
    3 Xonxiangnam Samnuelnarayan  33
    ;
    proc print noobs;
    run;

    This trick works in reading data from external file.
    data temp;
    infile "C:\Users\Deepanshu\Desktop\file1.txt";
    input ID Name & $30. Score;
    proc print noobs;
    run;

    Avoid Truncation in PROC IMPORT

    This tutorial explains how to stop truncation in character variables while importing CSV or Tab files with PROC IMPORT. It is a common issue when your CSV file has a character variable having inconsistent length such as open-end comments, company names and addresses etc.

    Important Note :
    By default, SAS scans 20 rows to determine the appropriate data type and length for the columns.

    Sample Dataset

    The sample data is shown in the image below. We have two variables named ID and Score. ID is a numeric variable and the Score is a character variable.

    Image may be NSFW.
    Clik here to view.
    Sample Dataset

    Importing CSV File with PROC IMPORT 
    /* For demonstration, use 3 rows for guessing the column length */
    proc import datafile="C:\Users\Deepanshu\Documents\dat2.csv"
        dbms=csv replace
        out=temp;
        guessingrows=3; /* if omitted, the default is 20 */
    proc print noobs;
    run;
    Output
    The numeric variable "ID" didn't get truncated. However, the character variable Score got truncated. As we have defined guessingrows=3, SAS considers the length of the character variable based on the third row (including header row) of the respective variable.

    Image may be NSFW.
    Clik here to view.
    PROC IMPORT : Truncation Issue

    For demonstration purpose, we have used guessingrows=3. If this option is omitted, SAS would scan first 20 rows.

    Method I : Fix Truncating Character Variables

    The simplest way to fix this issue is to use the higher number in GUESSINGROWS option.

    Change GUESSINGROWS to 3000 (or higher value)
    proc import datafile="C:\Users\Deepanshu\Documents\dat2.csv"
        dbms=csv replace
        out=temp;
        guessingrows=3000;
    proc print noobs;
    run;
    In SAS 9.2, the maximum value of GUESSINGROWS is 32,767.
    In SAS 9.3 or above, the maximum value of GUESSINGROWS is 2147483647
    To define the max value, write GUESSINGROWS = MAX

    Should I use GUESSINGROWS= MAX for simplicity?

    It depends. If your file is heavy and contains hundreds of thousands of records, it would make the import process VERY SLOW. You might find that earlier it was taking 20-30 seconds to import the file when you were not using  GUESSINGROWS= MAX. Later it is taking 5-10 minutes to import it. If your file is short, don't hesitate to use GUESSINGROWS = MAX.


    Method 2 : Use the generated PROC IMPORT code and Modify it

    Step 1. Run PROC IMPORT Code Once

    440      data WORK.TEMP    ;
    441      %let _EFIERR_ = 0; /* set the ERROR detection macro variable */
    442      infile 'C:\Users\Deepanshu\Documents\dat2.csv' delimiter = ',' MISSOVER DSD lrecl=32767
    442! firstobs=2 ;
    443         informat ID best32. ;
    444         informat Score $6. ;
    445         format ID best12. ;
    446         format Score $6. ;
    447      input
    448                  ID
    449                  Score $
    450      ;
    451      if _ERROR_ then call symputx('_EFIERR_',1);  /* set ERROR detection macro variable */
    452      run;

    Step 2. Copy the generated import code from the log to your program, remove the line numbers.

    Step 3. Change width of the Score Variable from 6 to 30 in both INFORMAT and FORMAT. It's done!

    Other Application of GUESSINGROWS

    It is useful if you have both character and numeric values in a variable and the first 20 observations are all numeric and the remaining observations are character values. So SAS would make all the character values blank.

    Image may be NSFW.
    Clik here to view.
    Determine Variable Type

    When to use IF and %IF in SAS Macros

    Most of the programmers who are new to SAS macro programming are confused between the IF condition and %IF in SAS Macros. The usage of DO END and %DO %END in macro programming also creates confusion. This tutorial describes the difference with examples which would help to understand the practical usage of these techniques.

    When to use IF and %IF in SAS Macros

    1. IF statement cannot be used outside data step whereas %IF can be used outside and inside data step but within the macro.

    Example 1 : 

    In the following program, we are telling SAS to check the value if it is greater than 10 and then run procedure dependending on the conditional statement.

    %IF works to run procedures - 
    %macro temp(N=);
    %if &N. > 10 %then %do;
    proc means data = sashelp.class MEAN;
    var age;
    run;
    %end;
    %else %put better luck next time;
    %mend;
    %temp(N=19);
    IF Statement does not work to run procedure. 
    %macro temp2(N=);
    data _null_;
    if &N. > 10 then do;
    proc means data = sashelp.class MEAN;
    var age;
    run;
    end;
    else put "the value is less than or equal to 10";
    run;
    %mend;
    %temp2(N=11);

    2. The %IF can only be used inside of a macro. In other words, you cannot use it in a program without it in a macro definition (%macro yourmacro; %mend;)

    The following program does not work as the %IF is not valid outside macro. 
    %let N = 12;
    %if &N. > 10 %then %do;
    proc means data = sashelp.class MEAN;
    var age;
    run;
    %end;
    %else %put better luck next time;


    3. .SAS Macro will be executed first and once completed, data step statements will be executed.

    %macro test;
    data temp;
    do j =1 to 5;
    N = j *5;
    put N;
    %let i = 1;
    %if &i %then %put the value of i is equal to 1;
    end;
    run;
    %mend;
    %test;
    Image may be NSFW.
    Clik here to view.
    %IF vs IF statement
    First Step - SAS checks for macro statements/macro variables and executing them. In this case, it sets i is equal to 1, then writes a log " the value of i is equal to 1". Once this process is completed, it checks DO LOOP and run iterations and multiply each iteration value by 5 and prints to the log.

    When either of DO END or %DO %END can be used

    If you're generating code to automate repetitive task within a data step, and you can use either %do-%end or do-end.

    In the following program, we are generating 5 values starting from 5 and ends with 25 with the difference of 5 between values.

    Method I : DO END
    data temp;
    do j =1 to 5;
    N = j *5;
    output;
    end;
    drop j;
    run;

    Method II : %DO %END
    %macro test;
    data temp;
    %do j = 1 %to 5;
    N = &j. *5;
    output;
    %end;
    run;
    %mend;
    %test;

    How to deal insignificant levels of a categorical variable

    This tutorial describes how to interpret or treat insignificant levels of a independent categorical variable in a regression (linear or logistic) model. It is one of the most frequently asked question in predictive modeling.

    Case Study
    Suppose you are building a linear (or logistic) regression model. In your independent variables list, you have a categorical variable with 4 categories (or levels). You created 3 dummy variables (k-1 categories) and set one of the category as a reference category. Then you run stepwise / backward/ forward regression technique and you found only one of the category coming out statistically significant based on p-value and the remaining 3 categories are insignificant. The question arises - should we remove or keep these 3 categories having insignificant difference? should we include the whole categorical variable or not?

    Solution
    In short, the answer is we can ONLY choose whether we should use this independent categorical variable as a whole or not. In other words, we should only see whether the categorical variable as a whole is significant or not. We cannot include some categories of a variable and exclude some categories having insignificant difference.

    Why we cannot choose categories of a variable

    Suppose you have a nominal categorical variable having 4 categories (or levels). You would create 3 dummy variables (k-1 = 4-1 dummy variables) and set one category as a reference level. Suppose one of them is insignificant.  Then if you exclude that dummy variable, it would change the reference level as you are indirectly combining that insignificant level with the original reference level. It would have a new reference level and interpretation would change. Moreover, excluding the level may make the others insignificant.


    How it works

    Suppose you have 2 continuous independent variables - GRE (Graduate Record Exam scores), GPA (grade point average) and 1 categorical independent variable- RANK (prestige of the undergraduate institution and levels ranging from 1 through 4. Institutions with a rank of 1 have the highest prestige, while those with a rank of 4 have the lowest ). Dependent variable - ADMIT (admission into graduate school)


    First Step,  3 dummy variables are entered into the model as set as (K-1) dummy variables where K=4 is the number of categories in the variable 'rank'.


    Run Model
    # Read and prepare data
    dt <- read.csv("http://www.ats.ucla.edu/stat/data/binary.csv")
    dt$rank <- as.factor(mydata$rank)

    # First Model (Including 'rank')
    logit <- glm(admit ~ gre + gpa + rank, data = dt, family = "binomial")

    #Summary of first model
    summary(logit)
    Image may be NSFW.
    Clik here to view.
    Logistic Regression Results

    Interpretation
    The category (or level) 1 of 'rank' variable has been set reference category and coefficient of rank2 means the difference between the coefficient of rank1 and the rank2. The p-value tells us whether the difference between the coefficient of the rank1 and the rank2 differs from zero. In this case, it is statistically significant from 0 as p-value is less than 0.05. The same interpretation holds for other 2 categories - rank3 and rank4.

    Strategy : Build 2 Models (With and Without the categorical variable)

    We can make decision about inclusion of the variable by building 2 models -with or without the variable and then check a likelihood ratio test.
    # Second Model (Excluding 'rank')
    logit2 <- glm(admit ~ gre + gpa, data = dt, family = "binomial")
    #Summary of second model
    summary(logit2)

    Likelihood Ratio Test

    It is performed by estimating two models and comparing the fit of one model to the fit of the other. Removing predictor variables from a model will almost always make the model fit less well but it is necessary to test whether the observed difference in model fit is statistically significant. It tests whether this difference is statistically significant.
    #Likelihood Ratio Test
    anova(logit, logit2, test="LRT")
    Image may be NSFW.
    Clik here to view.
    Likelihood Ratio Test Results
    Since p-value is less than 0.05, it means the difference is significant and the variable 'rank' should be included in the model.

    We can further calculate AUC (Area under curve) of both the models.
    #Prediction - First Model
    pred = predict(logit,dt, type = "response")
    #Prediction - Second Model
    pred2 = predict(logit2, dt, type = "response")
    #Storing Model Performance Scores
    library(ROCR)
    # Calculating Area under Curve - First Model
    perf <- performance(prediction(pred ,dt$admit),"auc")
    perf
    # Calculating Area under Curve - Second Model
    perf2 <- performance(prediction(pred2 ,dt$admit),"auc")
    perf2
    The AUC score of the first model (including rank) is 0.6928 and the AUC of the other model is 0.6354. It shows first model fits the model well.

    How about combining categories?

    There is no clear-cut answer. Sometimes, it makes sense to combine categories and use it in the model. It all depends on the nature and physical meaning of the variable. Sometimes, it does not make sense to combine the categories.

    Write VBA in SAS

    This tutorial explains how we can write Visual Basic for Application (VBA) code in SAS. VBA is a programming language for automating repetitive tasks in MS Excel and other MS Office applications. It is one of the powerful language for analysing data and reporting numbers. VBA is mainly used to create macros in Excel. By integrating excel with SAS, you can format the excel report and create pivot table from SAS. It would make the automation process to next level and increase operational efficiency of a project.

    Write VBA (VB Script) in SAS : Examples

    Example 1 : Create a new workbook and type in a cell

    The following SAS program opens a sample excel workbook and type 'Welcome to Excel' in cell A1. The translated VB Script would be stored in the temp location by the name 'vbscript'. Type %put vba_loc; to see the location of the code.
    options noxwait noxsync;
    %let vba_loc=%sysfunc(getoption(WORK))\vbscript.vbs;
    data _null_;
       file "&vba_loc";
       put "Set objExcel = CreateObject(""Excel.Application"")  ";
       put "objExcel.Visible = True ";
       put "objExcel.DisplayAlerts=False";
       put "Set wb = objExcel.Workbooks.Add";
       put "wb.Activesheet.Range(""A1"").Value=""Welcome to Excel""";
       x "'&vba_loc\'";
    run;
    Note :

    1. options noxwait noxsync
    These options would tell SAS to automatically close command prompt window and the SAS System does not wait for the application to finish.

    2. %let vba_loc
    It is the location where visual basic script is stored. Open the file in notepad to see the code.
    Image may be NSFW.
    Clik here to view.
    VB Script in SAS
    3. Type each line of VBA code in put statement and make sure adding extra double quote whenever you use double quote in VBA.

    Example 2 : Enter a Formula in Excel from SAS

    The following SAS program opens a workbook and enter a formula in cell B2 and sum the range A2:A6 and later saves the workbook.
    options noxwait noxsync;
    %let vba_loc=%sysfunc(getoption(WORK))\vbscript.vbs;
    %let open_workbook = C:\Users\Deepanshu\Documents\Book1.xlsx;
    data _null_;
       file "&vba_loc";
       put "Set objExcel = CreateObject(""Excel.Application"")  ";
       put "objExcel.Visible = True ";
       put "objExcel.DisplayAlerts=False";
       put "Set wb = objExcel.Workbooks.Open(""&open_workbook"")";
       put "wb.sheets(""Sheet1"").Range(""B2"").Formula = ""=SUM(A2:A6)""";
       put "wb.save";
       x "'&vba_loc\'";
    run;

    Example 3 : Insert an Image in Excel from SAS
    options noxwait noxsync;
    %let vba_loc=%sysfunc(getoption(WORK))\vbscript.vbs;
    %let open_workbook = C:\Users\Deepanshu\Documents\Book1.xlsx;
    data _null_;
       file "&vba_loc";
       put "Set objExcel = CreateObject(""Excel.Application"")  ";
       put "objExcel.Visible = True ";
       put "objExcel.DisplayAlerts=False";
       put "Set wb = objExcel.Workbooks.Open(""&open_workbook"")";
       put "Set Xlsheet = wb.Worksheets(""Sheet1"")";
       put "Xlsheet.Pictures.Insert(""C:\Users\Public\Pictures\Sample Pictures\Desert.jpg"")";
       put "wb.save";
       x "'&vba_loc\'";
    run;

    Example 4 : Apply Filter, Make Headers Bold and Freeze Panes from SAS

    Step 1 : Export Sample Data to Excel and use it further to format it from SAS.
    proc export data = sashelp.prdsale outfile= "C:\Users\Deepanshu\Documents\Example.xlsx";
    run;
    Step 2 : Formatting in Excel from SAS
    options noxwait noxsync;
    %let vba_loc=%sysfunc(getoption(WORK))\vbscript.vbs;
    %let open_workbook = C:\Users\Deepanshu\Documents\Example.xlsx;
    data _null_;
       file "&vba_loc";
       put "Set objExcel = CreateObject(""Excel.Application"")  ";
       put "objExcel.Visible = True ";
       put "objExcel.DisplayAlerts=False";
       put "Set wb = objExcel.Workbooks.Open(""&open_workbook"")";
       put "Set xl = wb.Worksheets(1)";
       put "xl.Activate";
       put "With wb.ActiveSheet";
       put ".Rows(1).Font.Bold = True";
       put ".AutoFilterMode = False";
       put ".Rows(1).AutoFilter";
       put ".Columns.AutoFit";
       put ".Range(""A2"").Select";
       put "End With";
       put "objExcel.ActiveWindow.FreezePanes = True";
       put "wb.save";
       x "'&vba_loc\'";
    run;
    Example 5 : Apply Pivot Table in Excel from SAS

    The following program tells SAS to apply pivot table in Excel from SAS.
    %macro SAS_VBA (open_workbook=, sheet=, rowlabels=, columnlabels= ,evalfieldss=, stat=);
    %let script_loc=%sysfunc(getoption(WORK))\vbscript.vbs;
    %let sheetname = PivotTable;
    data _null_;
       file "&script_loc";
       put "Set objExcel = CreateObject(""Excel.Application"")  ";
       put "objExcel.Visible = True ";
       put "objExcel.DisplayAlerts=False";
       put "Set wb = objExcel.Workbooks.Open(""&open_workbook"")";
       put "Set Xlsheet = wb.Worksheets(""&sheet"")";
       put "Xlsheet.Select";
       put "lastcell = objExcel.cells.specialcells(11).address";
       put "wb.Sheets.Add";
       put "wb.Activesheet.name = ""&sheetname""";
       put "wb.Sheets(""&sheetname"").select";
       put "wb.ActiveSheet.PivotTableWizard SourceType=xlDatabase, wb.sheets(""&sheet"").Range(""A1""& "":""& lastcell),""&sheetname!R1C1"",""pvttbl""";

       /* Loop through the list of row fields and set them in the pivot table */
        %let i=0; 
        %do %while(%scan(&rowlabels,&i+1,%str( )) ne %str( ));     
          %let i = %eval(&i+1);   
          %let var = %scan(&rowlabels,&i,%str( ));
          put "wb.ActiveSheet.PivotTables(""pvttbl"").PivotFields(""&var"").Orientation =""1""" ;
        %end; 

      %let i=0; 
        /* Loop through the list of column fields and set them in the pivot table */
        %do %while(%scan(&columnlabels,&i+1,%str( )) ne %str( ));     
          %let i = %eval(&i+1);   
          %let var = %scan(&columnlabels,&i,%str( ));
         put "wb.ActiveSheet.PivotTables(""pvttbl"").PivotFields(""&var"").Orientation =""2""" ;
        %end;

        /* Loop through the list of data fields and set them in the pivot table */
        %let i=0; 
        %do %while(%scan(&evalfieldss,&i+1,%str( )) ne %str( ));     
          %let i = %eval(&i+1);   
          %let var = %scan(&evalfieldss,&i,%str( ));      
     %let istat = %scan(&stat,&i,%str( ));      
         put "wb.ActiveSheet.PivotTables(""pvttbl"").AddDataField
              wb.ActiveSheet.PivotTables(""pvttbl"").PivotFields(""&var""),
         ""&istat of &var"","
     %IF %UPCASE(&istat) EQ SUM %THEN "-4157";
     %IF %UPCASE(&istat) EQ COUNT %THEN "-4112";
     %IF %UPCASE(&istat) EQ AVERAGE %THEN "-4106";;
        %end;

       /* Hide Field List*/
    put "objExcel.ActiveWorkbook.ShowPivotTableFieldList = False";
        put "wb.save";
       x "'&script_loc\'";
    run;
    %mend;

    %SAS_VBA (open_workbook= C:\Users\Deepanshu\Documents\example.xlsx, sheet = PRDSALE, rowlabels= COUNTRY, 
    columnlabels = DIVISION, evalfieldss= Actual Predict, stat= sum sum);
    In the above macro, parameter "sheet" refers to the sheet wherein data is stored.

    SAS : Add leading zeros to Variable

    This tutorial describes how we can add leading zeros to a numeric or character variable in SAS. It's one of the most frequently encountered data problem. It generally happens when we have some product codes that need to have leading zeros if the product code has a length less than defined length (let's say 10 characters). It sometimes become a daunting task when we merge two tables and the primary key is of different types and leading zeros is missing in one of the tables.

    Create Sample Data

    We would use the following dataset to demonstrate the way to add leading zeros to the numeric variable 'x'
    data xy;
    input x y;
    cards;
    1234 33
    123 44
    1236 45
    ;
    run;
    If the variable in which you want to add leading zeros contains only numeric values, we can simply use Zw.d format. In this case, we made length of the newly transformed variable as 6.
    data temp;
    set xy;
    xx = put(x, z6.);
    run;
    z6. tells SAS to add 'k' number of leading zeros to the variable 'x' to maintain 6 as a length of the newly transformed variable 'xx'. In this case, 'k' = (6 - number of values in each observation in variable 'x'). In the first observation, it would add 2 leading zeros as the number of values is 4. However, it would add 3 leading zeros in second observation as it has 3 values.

    The output is shown below :
    Image may be NSFW.
    Clik here to view.
    Output : Add leading zeros

    Add leading zeros to the Character Variable

    Suppose you have a character variable in which you want to add leading zeros. In this case, we cannot use zw.d format as it only works for numeric variable.
    data xy;
    input x$ y;
    cards;
    A1234 33
    A123 44
    A1236 45
    ;
    run;
    We need to keep 6 as length of the newly transformed variable.
    data temp;
    set xy;
    xx = cats(repeat('0',6-length(x)-1), x);
    proc print;
    run;
    CATS function is used to concatenate 0s with the variable 'x'. REPEAT function is used to repeat 0s. LENGTH function is used to determine the number of characters in the variable 'x'.  6 - length(x) -1 translates to ( 6- number of letters and values in the variable x - 1).

    Image may be NSFW.
    Clik here to view.
    Output

    R : Add Linear Regression Equation and RSquare to Graph

    In this article, we would see how to add linear regression equation and r-squared to a graph in R. It is very useful when we need to document or present our statistical results. Many people are familiar with R-square as a performance metrics for linear regression. If you are novice in linear regression technique, you can read this article - Linear Regression with R

    Create Sample Data

    The following program prepares data that is used to demonstrate the method of adding regression equation and rsquare to graph.
    x = c(1:250)
    mydata= data.frame(x, y= 30 + 2.5 * x + rnorm(250,sd = 25))
    Load Required Library
    library(ggplot2)
    R Function
    linear = function(k) {
      z <- list(xx = format(coef(k)[1], digits = 2),
                yy = format(abs(coef(k)[2]), digits = 2),
                r2 = format(summary(k)$r.squared, digits = 3));
      if (coef(k)[2] >= 0)  {
        eq <- substitute(italic(hat(y)) == xx + yy %.% italic(x)*","~~italic(r)^2~"="~r2,z)
      } else {
        eq <- substitute(italic(hat(y)) == xx - yy %.% italic(x)*","~~italic(r)^2~"="~r2,z)  
      }
      as.character(as.expression(eq));              
    }
    fo = y ~ x
    linplot <- ggplot(data = mydata, aes(x = x, y = y)) + geom_smooth(method = "lm", se=FALSE, color="black", formula = fo) +  geom_point()
    linplot1 = linplot + annotate("text", x = 100, y = 500, label = linear(lm(fo, mydata)), colour="black", size = 5, parse=TRUE)
    linplot1
    Image may be NSFW.
    Clik here to view.
    Regression Line

    Run VBA in R

    This tutorial describes how to run Visual Basic (VBA) script in R.
    Image may be NSFW.
    Clik here to view.
    VBA in R
    Most of the times, we need to integrate R with Excel to make formating changes in excel workbook. With VBA, we can do a lot of things such as creating pivot table, applying functions, reshaping data, creating charts etc. It would help to automate the whole process. For example, building and validating a predictive model in R and exporting predictive probability scores to excel workbook. In R, call vb script to open the exported excel file and prepare gain and lift charts in excel.

    Step 1 : Write VB Script and Save it as .vbs file

    Sample Visual Basic Script

    The following program tells Excel to open the workbook and apply borders to the used range in the sheet.
    Set objExcel = CreateObject("Excel.Application")
    objExcel.Visible = True
    objExcel.DisplayAlerts=False
    Set wb = objExcel.Workbooks.Open("C:\Users\Deepanshu\Documents\example.xlsx")
    Set Xlsheet = wb.Worksheets("PRDSALE")
    Xlsheet.UsedRange.Borders.LineStyle = xlContinuous
    Xlsheet.UsedRange.Borders.Color = RGB(0, 0, 0)
    Xlsheet.UsedRange.Borders.Weight = xlThick
    wb.save
    Paste the above script in Notepad and save it as .vbs file
    For example, give a name to the file as border.vbs and select 'All Files' from 'Save as type:' (see the image below).
    Image may be NSFW.
    Clik here to view.
    VBS File

    Step 2 : Run the following code in R
    pathofvbscript = "C:\\Users\\Deepanshu\\Documents\\border.vbs"
    shell(shQuote(normalizePath(pathofvbscript)), "cscript", flag = "//nologo")
    pathofvbscript : It is the path where visual basic script is stored. The shell function calls a System Command, using a Shell.

    VB Script : Run Excel Macro from R

    The following program tells excel to open the workbook wherein macro is stored and then run it.
    Set objExcel = CreateObject("Excel.Application")
    objExcel.Visible = True
    objExcel.DisplayAlerts=False
    Set wb = objExcel.Workbooks.Open("C:\Users\Deepanshu\Documents\Book1.xls")
    objExcel.Application.Run "Book1.xls!macro1"
    wb.save

    SAS : Custom Sort Order

    In this tutorial, we will cover how to apply custom sort order in SAS.
    Image may be NSFW.
    Clik here to view.
    Custom Sort Order in SAS

    Most of the times, we want to sort variables manually with a custom sort order instead of alphabetically. For example, we have a variable called 'group'. It contains three unique values such as 'High', 'Low' and 'Medium'. We want values to be sort in such a way that 'High' appears first and then followed by 'Medium' and then 'Low'.
    Image may be NSFW.
    Clik here to view.
    Custom Sort

    Sample Data
    The following program would be used to create a sample data.
    data temp;
    input group$;
    cards;
    High
    Low
    Medium
    ;
    run;

    What's wrong with PROC SORT? 

    PROC SORT sorts the character variable alphabetically. PROC SORT would return 'High' in the first observation, followed by 'Low' and then 'Medium'. We want 'Medium' to be appeared in second observation and 'Low' in third observation.


    Method 1 : Proc Format to define Sort Order
    proc format;
    value $rank
    'High' = 1
    'Medium' = 2
    'Low' = 3;
    run;
    proc sql;
    select * from temp
    order by put(group, $rank.);
    quit;
    The $rank format is created to define custom sort order. The keyword $ is used to tell SAS the values are character. Later, put function is used to apply the manual sort order and ORDER BY is used to sort the variable.

    Method 2 : Proc SQL CASE WHEN Method
    proc sql;
    select * from temp
    order by case when group = 'High' then 1
    when group = 'Medium' then 2
    when group = 'Low' then 3 end;
    quit;
    The SQL 'CASE WHEN' syntax is an alternative to IF THEN ELSE statement in SAS.

    SAS : Converting Number Format to Date Format

    This tutorial focuses on converting a number format variable to a date format variable.
    Image may be NSFW.
    Clik here to view.
    Convert Number Format to Date Format
    Suppose you have a numeric variable that contains dates. You are asked to convert it to SAS date format. It seems to be a easy task but it sometimes becomes a daunting task when you don't know how SAS treats dates. The input data is shown below -
    Image may be NSFW.
    Clik here to view.
    Raw Date Values
    Sample Data

    The following program is used to create a sample data.
    data temp;
    input date;
    cards;
    20160514
    19990505
    20131104
    20110724
    ;
    run;
    Solution
    data temp2;
    set temp;
    newdate = input(put(date,8.),yymmdd8.);
    format newdate date10.;
    proc print noobs;
    run;
    Image may be NSFW.
    Clik here to view.
    Output
    Explanation

    1. PUT Function is used to convert the numeric variable to character format.
    2. INPUT Function is used to convert the character variable to sas date format
    3. FORMAT Function is used to display the SAS date values in a particular SAS date format. If we would not use format function, SAS would display the date in SAS datevalues format. For example, 20588 is a sas datevalue and it is equivalent to '14MAY2016'.
    Viewing all 425 articles
    Browse latest View live